Myth #1 · Moving averages
Does the Golden Cross Work? We Tested 72 Strategies
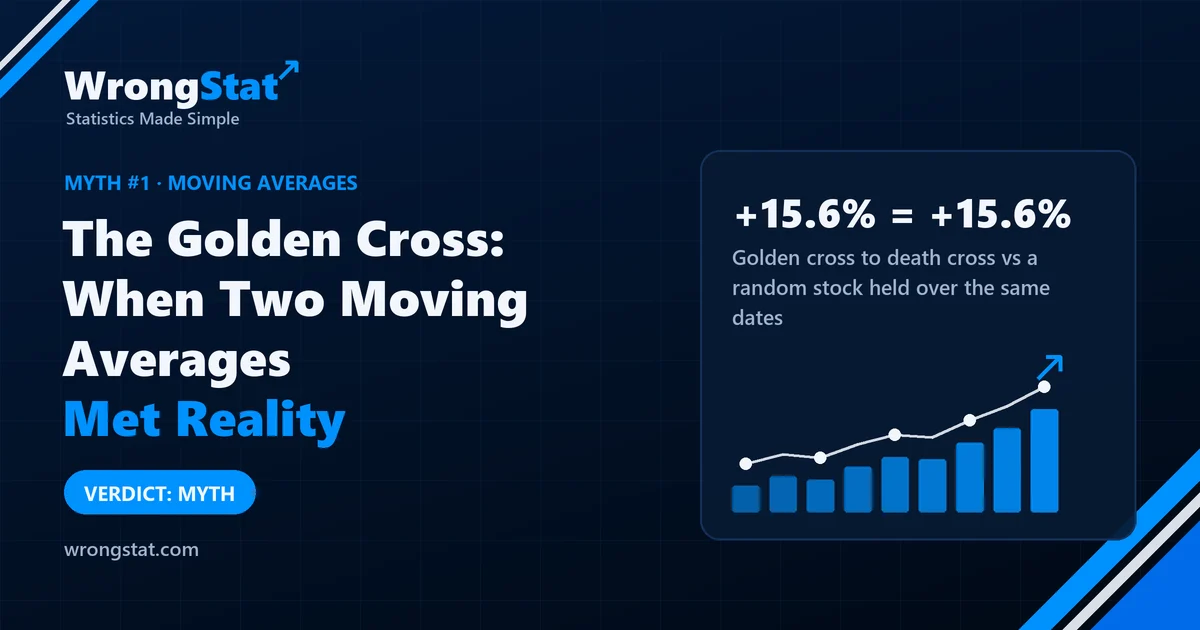
Verdict: myth. Across 72 versions and 1.5 million signals, buying on a moving-average cross did no better than buying a random stock on the same day. The profits were real. They just came from the market going up, not from the cross.
On Friday, Uncle Gary told me at the barbecue that when the 50-day crosses the 200-day, you buy. He said it with the confidence of a man who has been waiting since 2008 to break even.
Gary isn't alone. The golden cross is probably the most famous signal in trading. It's on every charting site, in every beginner course, and in roughly half of all financial news headlines when the S&P 500 does it.
So we stopped arguing and tested it.
What we tested
- 577 US stocks, daily data from 2010 to 2026: 1,555,278 crossover signals.
- Six pairs of moving averages, from fast (5/20 days) to the classic golden cross (50/200), each as a simple and an exponential average.
- Buy at the next day's open after the fast average crosses above the slow one. We also tested the mirror image: shorting after the "death cross".
- Exit with a stop that trails the price at 2, 3 or 4 times the stock's typical daily range (ATR), for up to 120 trading days. Separately, we also tested the textbook version: hold until the opposite cross.
- Costs: 0.05% per round trip for buying, 0.30% for shorting.
- Control group: on the same day, with exactly the same rules, a stock picked at random.
That's 6 pairs × 2 types of average × 3 stop widths × buy or short = 72 versions.
What we found
Buying on the cross made money. On average +0.5% to +2.0% per trade after costs, depending on the stop. That sounds like a strategy.
Then we did the same thing with a random stock on the same day. It made almost exactly the same. The difference was between +0.02 and +0.06 percentage points per trade, which is nothing.
Shorting on the death cross lost money: -1.1% to -2.5% per trade, right only 26-30% of the time. Betting against a market that mostly goes up is an expensive hobby.
The textbook version did no better. Holding from a 50/200 golden cross to the next death cross made +15.6% per trade. A random stock held over exactly the same dates made… +15.6%. The golden cross was right 47% of the time.
| Version | Per trade, after costs | Better than a random stock by |
|---|---|---|
| Buy on the cross, trailing stop | +0.5% to +2.0% | +0.02 to +0.06 pp |
| Short on the cross, trailing stop | -1.1% to -2.5% | about 0 |
| Golden cross to death cross (50/200) | +15.6% | +0.03 pp |
Out of 72 versions, 5 looked "statistically significant" at first. Two pointed the right way (EMA 20/50 and EMA 10/30, about +0.1 points over the random stock). But when you try 72 things, a few will look good by pure luck. After correcting for that, none survived. The only result that did survive was shorting on the 50/200 death cross, and it was worse than random.
"Maybe it only works in a bull market?" We split every signal by market conditions: rising or falling market, calm or panicky. Still nothing, in any of them.
Golden cross to death cross (50/200), average per trade
Statistics for noobs: the control group
Most "this strategy works" claims compare the strategy with doing nothing. That's the wrong comparison.
From 2010 to 2026 US stocks mostly went up. Almost anything that buys a stock and holds it for a few months made money. The real question is whether the signal adds anything on top of that. So we ask: would a monkey, buying a random stock on the same day and following the same rules, have done the same?
For the golden cross, the monkey did just as well.
The moral
The golden cross isn't a scam. It's a complicated way of being in the market most of the time, and the market did the work. Holding an index does the same thing with far fewer trades.
Uncle Gary is still grilling. The market is still doing its own thing.
What this test can't tell you
- Survivorship bias. We only used stocks that are listed today. Companies that went bust are missing, which flatters the buying side for both the cross and the random stock.
- Daily data only. We did not test intraday versions.
- Our exit rules. We tested trailing stops and the opposite cross. Other exits might give other numbers, though the problem here is the entry, not the exit.
Simulation on historical data, not real trades. Period: 2010-2026, 577 US stocks listed today (survivorship bias may inflate results). 72 variants tested; results corrected for multiple testing. Costs included as described above. Historical results do not guarantee future returns. This is educational content, not financial advice.