Myth #3 · Buying pullbacks
Does Buying the Dip Work? We Checked Which Dips.
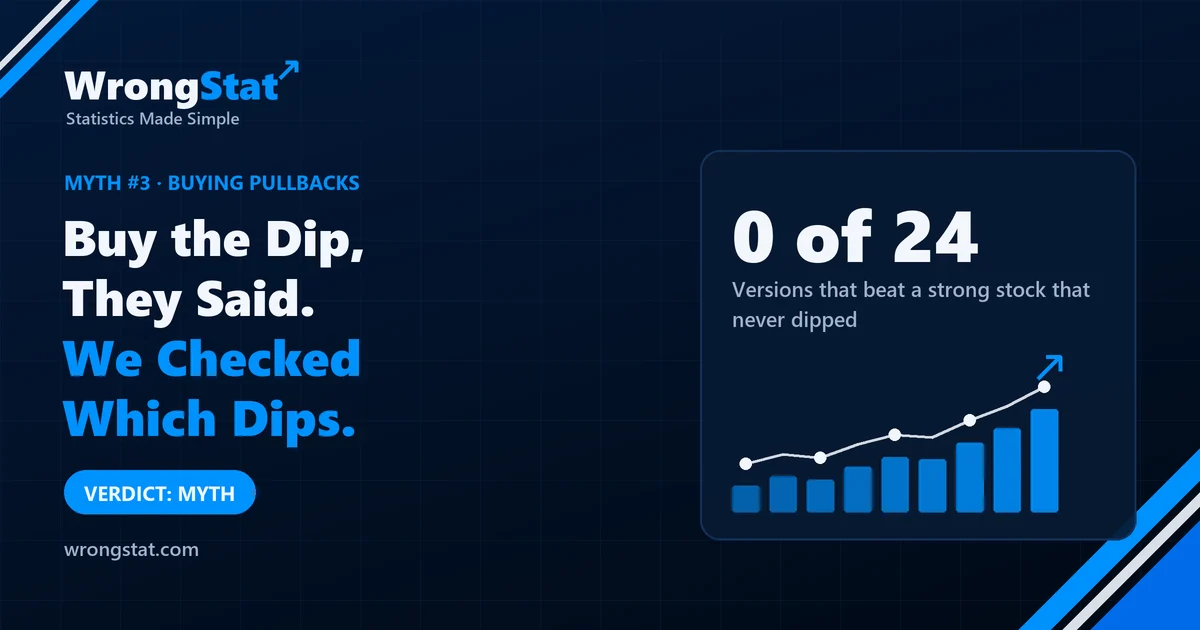
Verdict: myth. Buying a strong stock after a dip made money. Buying a similar strong stock on the same day, without waiting for any dip, made the same money. Across 30 versions, including one modelled on a championship-winning trader, the dip added nothing. The trend did all the work.
Cousin Kevin watched a video of a trader who won an investing championship with a return of more than 900% in a single year. The method sounded simple: find a strong stock, wait for it to dip back to its support, buy when it starts rising again, and put a tight stop just below.
"Buy the dip," said Uncle Gary, nodding wisely. Gary says "buy the dip" about everything, including the guacamole.
Kevin was ready to quit his job. We asked him to wait while we checked.
What we tested
- About 530 US stocks, daily prices over more than 2,000 trading days, through rising, falling, calm and panicky markets.
- A strong stock: price above its 50-day moving average, which is above its 200-day one. A stricter version also required the stock to be in the top 30% of all stocks over the last three months.
- The dip: within the last 10 days the price came back to its 10, 20 or 50-day exponential average, and fell at least one ATR from its 20-day high.
- The buy signal: a day that closes above the previous day's high, above the average and above its own open. The bounce.
- The trade: buy at the next open, stop at the lowest low of the last three days. Exit at the stop or after 5 or 20 trading days. We also ran every version without a stop.
- 24 versions, each with between 18,000 and 76,000 trades. Costs: 0.05% per round trip.
Then we tried to do it the champion's way. Only market leaders: the top 5% of all stocks over three months, trading within 10% of their 52-week high. Instead of a fixed holding time, a trailing exit: sell when the price closes below its 10 or 20-day average, for up to 60 days. Results measured in R, the way traders like this talk about them. 6 more versions, between 2,056 and 7,930 trades each.
Two control groups, and why the second one matters
We compared every dip trade with two things on the same day, with exactly the same rules for exits and risk:
- A random stock. The usual check.
- A random strong stock that had not dipped. Same trend, same day, no pullback, no bounce. This is the one that answers the real question: does waiting for the dip add anything?
What we found
Buying the dip made money. On average +0.12% to +1.50% per trade after costs. Kevin started drafting his resignation letter.
Then we looked at the strong stocks that never dipped. They made the same. The difference was between -0.07 and +0.09 percentage points per trade. Out of 24 versions, not a single one was significantly better than simply holding a strong stock. Two were significantly worse.
Against a completely random stock, the best version did look better, by 0.17 points. But with 24 versions tested, that wasn't enough to rule out luck, and against strong stocks without a dip it shrank to -0.03.
The tight stop changed the feeling, not the result. With the stop at the recent low, losses were small. They were also frequent: only 38% to 43% of trades won over 20 days, and those versions did 0.17 to 0.30 points worse than the S&P 500 over the same period. Without the stop, the numbers looked better, but only because the stock was simply rising with the market.
The champion's way did no better. Leaders, trailing exit, results in R: 33% to 39% of trades won, with an average of +0.02R to +0.12R. Random leaders on the same days, with the same rules, made +0.00R to +0.09R. The difference was not significant in any of the 6 versions and flipped around between the first and second half of the data. The biggest winners were slightly bigger (the top 10% of trades gained 9.8% versus 8.0%), but not by enough to rule out chance.
| What we tested | Versions | Better than a strong stock without a dip | Significantly better |
|---|---|---|---|
| Dip in a strong trend | 24 | -0.07 to +0.09 pp | 0 of 24 |
| Market leaders, trailing exit | 6 | +0.05 to +0.47 pp | 0 of 6 |
Better than a strong stock that never dipped, per trade (percentage points)
So how did the champion do it?
We don't know, and neither does anyone copying the video. A mechanical rule on daily prices can't capture everything a real trader does: choosing stocks by judgement, trading within the day, using leverage, putting a big part of the account into a few trades, and trading smaller stocks that aren't on our list.
And one more thing. In a championship, you only hear from the winner. Plenty of other contestants traded similar ideas. Nobody watches their videos.
Statistics for noobs: pick the right comparison
If you only compare a strategy with a random stock, anything that buys strong stocks looks clever, because strong stocks in our data tended to keep rising for a while.
The fair question is narrower: compared with a strong stock that didn't dip, does the dip help? Ask it that way, and the magic disappears. A test is only as honest as the thing you compare it with.
The moral
The trend did the work, not the dip. Waiting for a pullback mostly changed how the trades felt: smaller losses, more of them, and a satisfying sense of buying at a discount.
Kevin has kept his job. Gary still says "buy the dip" about the guacamole. There, at least, it works.
What this test can't tell you
- Daily prices only. Intraday entries, which many dip traders use, were not tested.
- Fixed rules. We had to turn "the stock dipped to support" into exact numbers (10 days, one ATR, within 0.5% of the average). A human applying judgement might choose differently.
- No leverage, no small companies. Our list is about 530 larger US stocks.
- Survivorship bias. We used stocks listed today, which flatters buying for the strategy and the control groups alike.
Simulation on historical data, not real trades. About 530 US stocks listed today (survivorship bias may inflate results), daily prices over more than 2,000 trading days. 30 variants tested in total; results corrected for multiple testing. Costs of 0.05% per round trip included. Historical results do not guarantee future returns. This is educational content, not financial advice.