Myth #5 · Earnings
Should You Buy Stocks After Good Earnings? Post-Earnings Drift, Tested.
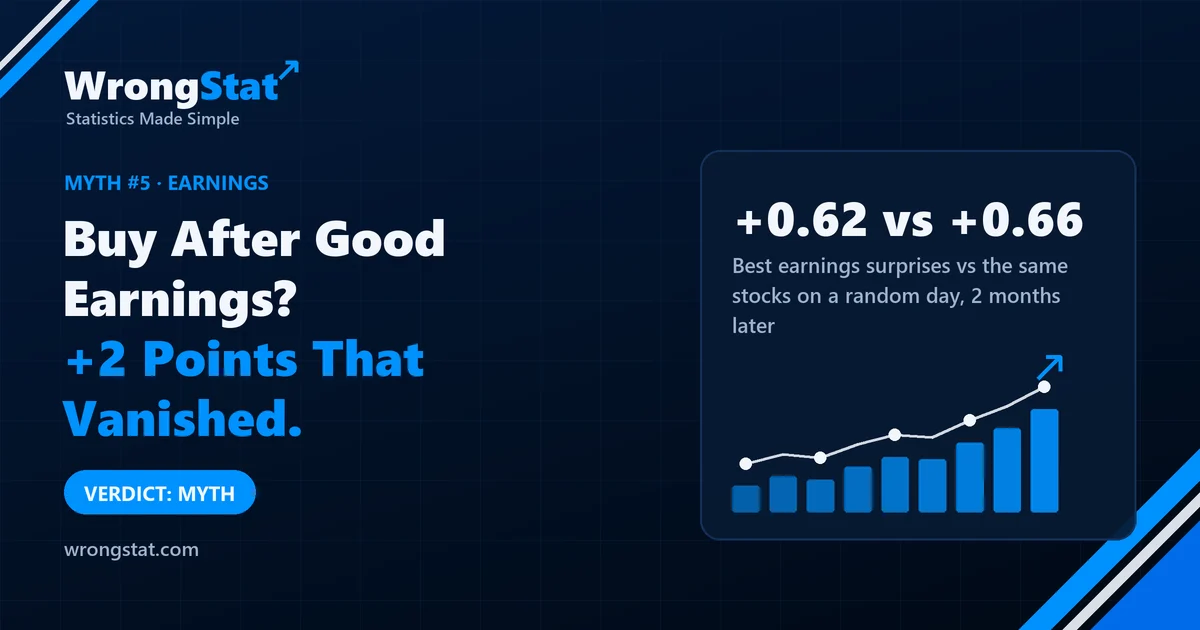
Verdict: myth, at least for anyone who only buys. Stocks with the best earnings surprises did no better than the same stocks on a random day. There was a gap of about 2 points between the best and the worst surprises, but it wasn't significant, it came almost entirely from the losers falling, and it shrank from about 3 points in 2020-2023 to half a point in 2024-2026.
Uncle Gary has found the strategy that, he says, "even the professors agree on". When a company reports better profits than expected, its stock doesn't just jump on the day. It keeps drifting up for weeks, because the market is slow to believe good news. Buy the beat, wait, collect.
Gary is not making this up. It's one of the oldest findings in finance research, first described in the late 1960s, and it has a proper name: post-earnings announcement drift.
Aunt Linda has one objection: "If the professors wrote it down fifty years ago, who's still leaving the money on the table?" Also a fair point. So we checked who was right.
What we tested
- 12,497 earnings reports from 531 US stocks, January 2020 to July 2026. That's 27 quarters of results.
- The surprise: how much the reported profit beat or missed what analysts expected, in percent. Within each quarter, we sorted the reports into five equal groups, from the worst surprises to the best.
- The trade: buy at the close of the day after the report. We don't know whether each company reported before the market opened or after it closed, so we waited a day to be sure the news was public. Then hold for 20, 40 or 60 trading days, roughly one, two and three months.
- The fair comparison: every result is measured against the S&P 500 over the same days. And as a placebo, we ran the same trade on the same stocks on a random date, with no earnings news at all.
- The bar: the result has to be statistically significant, counting each quarter as one data point, because reports in the same quarter tend to move together.
What we found
Gary's half: there was a gap. Stocks with the best surprises did better than stocks with the worst surprises: by 0.73 points after one month, 1.96 points after two months and 1.99 points after three. Adjusting for how jumpy each stock was barely changed it (about 2.1 to 2.2 points). So the professors weren't wrong. Something was there.
But it never passed the test. The closest it got was a t-statistic of 1.85 at two months. The usual bar is about 2. Over 27 quarters the gap swung around too much to tell it apart from luck.
Linda's half: it was fading. In 2020-2023 the gap was about 3 points. In 2024-2026 it was 0.4 to 0.6 points. Like cousin Kevin's Christmas bonus: generous in the good years, a gift card by 2024.
The part nobody thought about: Gary was buying the wrong half. The gap is a difference between two groups. So we looked at each group on its own.
| Vs the S&P 500, after | Best surprises | Same stocks, random day | Worst surprises |
|---|---|---|---|
| 1 month (20 days) | +0.32 pp | +0.38 pp | -0.41 pp |
| 2 months (40 days) | +0.62 pp | +0.66 pp | -1.34 pp |
| 3 months (60 days) | +0.39 pp | +1.75 pp | -1.60 pp |
The best surprises did slightly worse than buying the same stocks on any old day. Good news added nothing. Almost the whole gap came from the worst surprises falling behind the market.
So to collect it, you'd have to bet against the disappointing companies: short them, and buy the index against them. Shorting costs about 0.30% per round trip plus overnight fees. At a typical 0.02% a day, two to three months of fees add up to roughly 1.4 to 2 points. That's about the whole 1.3 to 1.6 points the losers lagged by. Buying, by contrast, costs only about 0.05% per round trip, but on the buying side there was nothing to collect.
Vs the S&P 500 after the report (percentage points)
Statistics for noobs: a gap is not a trade
"The best group beat the worst group by 2 points" sounds like 2 points of profit. It isn't. A gap between two groups only becomes money if you can stand on both sides of it: own the winners and bet against the losers, and pay for both.
If you can only buy, the right question is different: did the stocks I bought do better than the same stocks would have done anyway? That's what the random-day placebo is for. Here the answer was no.
The moral
Gary was right that the drift exists in the textbooks, and there was even a trace of it in our data. Linda was right that it was disappearing. Neither noticed that the trace sat on the side of the trade Gary never makes.
Gary's new plan is to buy the competitors of companies that disappoint. Linda says she saw this coming. She did, in 2024, which Gary says doesn't count because by then everyone did.
What this test can't tell you
- A short, mostly rising period. 2020 to 2026 was mostly a bull market, and 27 quarters is not a lot. The drift could behave differently over decades or in a long bear market.
- The first day is missing. We entered the day after the report, so any jump on the day itself isn't included. That's on purpose: by the time most people read the news, that day is gone.
- Survivorship bias. We used stocks listed today, so companies that collapsed after a bad report are missing. That probably makes the worst group look better than it was, and it's one reason even a random day beat the S&P 500 here.
- Our definition of surprise. We used the reported surprise in percent. Other measures, like the price jump on the day or revisions to forecasts, might sort the reports differently.
Simulation on historical data, not real trades. 12,497 earnings reports from 531 US stocks listed today, January 2020 to July 2026. Results measured against the S&P 500 over the same days, before costs; cost figures are typical buying and shorting costs, not taken from a specific broker. Significance tested on quarterly averages (27 quarters). Historical results do not guarantee future returns. This is educational content, not financial advice.