Myth #8 · Stop-loss
Does a Stop-Loss Protect Your Money? We Tested Tight and Wide Stops.
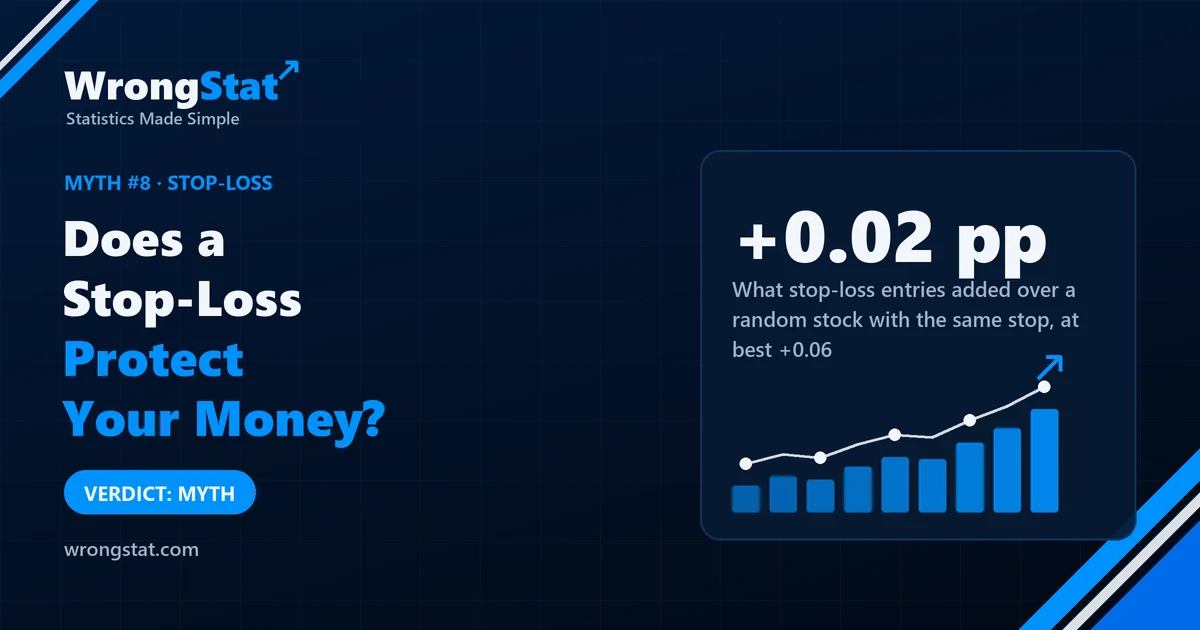
Verdict: half myth. A stop-loss changes the shape of your losses, not your average result. In our tests, stops never made an entry better than the same stop on a random stock bought the same day; tight stops meant more frequent small losses and a lower average, and wide stops looked better only because positions stayed open longer in a rising market. What a stop does do is cap a single loss. That's risk control, not profit.
Uncle Gary always uses a stop-loss. "It protects your capital," he says, which is what everyone says. He has been stopped out three times in a row this month, each time just before the price turned and went where he expected.
Gary believes the market can see his stop and comes to collect it. Aunt Linda thinks the market has more important things to do. We can't settle that one with daily data. But we can test what a stop actually does to results.
What we tested
- Test 1: entries on moving-average crosses in 577 US stocks, 2010 to 2026, 1,555,278 simulated entries. The stop started at 2, 3 or 4 times the ATR (the average daily range) and then trailed behind the highest price. Same rules applied to a random stock bought on the same day, as a control. Costs included.
- Test 2: buying pullbacks in strong stocks, once with a tight stop just under the recent low and once without a stop, holding for a fixed time. Compared with the S&P 500 over the same days.
- Test 3: a short-term strategy with stops at 1, 1.5 and 2.5 ATR, to see whether the stop distance changed the verdict.
What we found
Wider stops showed bigger profits, for a boring reason. On the buying side, the average trade made +0.5% with a 2-ATR stop and +2.0% with a 4-ATR stop. Looks like a lesson: give trades room. But the random stock with the same stop did almost exactly the same, within +0.02 to +0.06 percentage points. The wide stop simply kept positions open longer, about 36 trading days, in a market that mostly went up. The stop wasn't earning the money. The market was.
Tight stops turned profit into frequent small losses. In the pullback test, with a tight stop only 38% to 43% of trades were winners after 20 days, and the strategy trailed the S&P 500 by 0.17 to 0.30 points. Without the stop it beat the S&P 500 by 0.19 to 0.45 points, which is about what simply being in rising stocks gave. The tight stop made each loss small, and made losses happen much more often. The average didn't go up. It went down.
Stop distance didn't change any verdict. Moving the stop from 1 to 1.5 to 2.5 ATR changed the numbers a little and the conclusion not at all.
Shorts were worse. Betting on falls with the same stops lost 1.1% to 2.5% per trade, with only 26% to 30% winners. A stop doesn't fix a bet that's against the direction of the market.
Pullback strategy vs the S&P 500 after 20 days (percentage points)
About Gary's hunters
We can't test whether anyone hunts stops; that would need intraday data and a lot of imagination. But we don't need hunters to explain Gary's month. A typical stock moves about one ATR in an ordinary day. A stop placed one ATR away will be hit by an ordinary day, quite often, with nobody hunting anything. Three in a row is just the clumping of random bad luck.
Statistics for noobs: a seatbelt is not an engine
A stop-loss decides how you lose: lots of small losses (tight stop) or fewer, bigger ones (wide stop, or none). It doesn't decide whether the entry was any good. If the entry has no edge, no stop will give it one.
That doesn't make stops useless. Capping how much a single trade can take from you is real protection against ruin and against panic. Just don't confuse it with a strategy. And beware the high win rate of a wide stop or the low losses of a tight one: both are the stop talking, not the edge.
The moral
Gary has moved his stop further away. This month he hasn't been stopped out once. He's very pleased and calls it the new strategy. Linda points out that the stock has gone up because everything has gone up, and that his "strategy" is now mainly called "holding". Gary says that's what he meant all along.
What this test can't tell you
- Daily data only. Stops were checked at daily prices; intraday spikes and slippage would make tight stops look worse, not better.
- Our entries. We tested stops on entries that themselves had no edge. On a strategy with a real edge, stop placement could matter more.
- Risk isn't measured here. We looked at average results, not at the worst single loss or how a portfolio feels in a crash, which is exactly where stops help.
- A rising market and survivorship bias. 2010 to 2026 mostly went up, and we used stocks listed today.
Simulations on historical data, not real trades. Daily prices of US stocks listed today, 2010 to 2026, with trading costs. Historical results do not guarantee future returns. This is educational content, not financial advice.