Myth #12 · Attention
Do Stocks Go Up When Everyone Looks Them Up? We Tested Wikipedia Page Views.
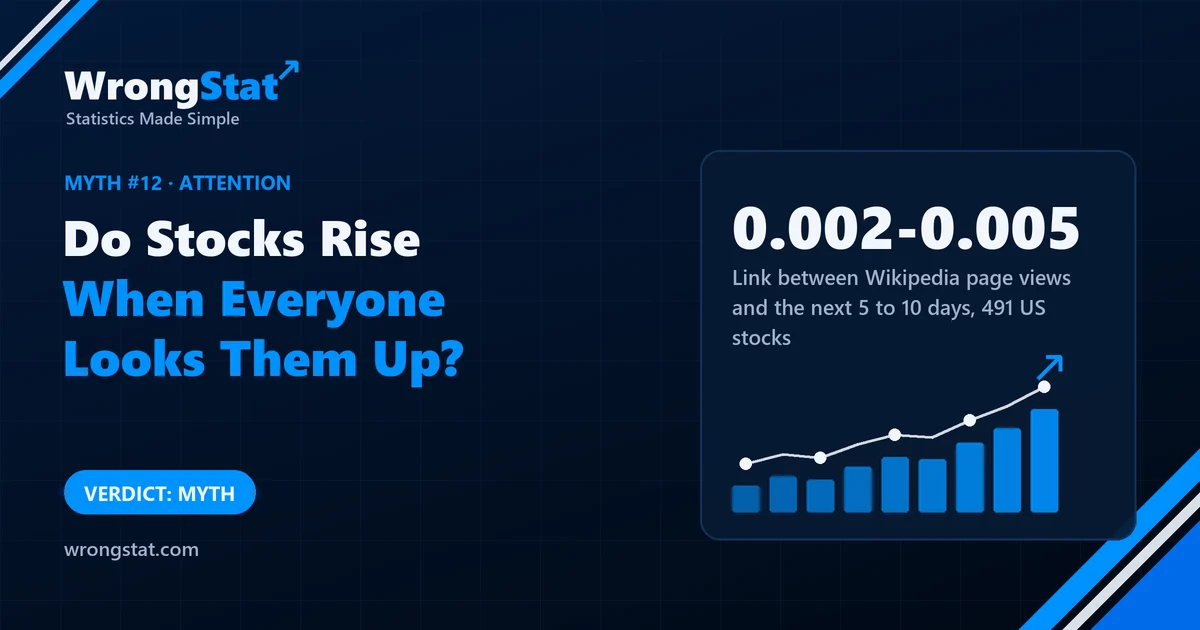
Verdict: myth, in the form we tested. For 491 US stocks from 2016 to 2026, jumps in Wikipedia page views told us nothing about the next 5 or 10 days compared with other stocks: an average rank correlation of 0.002 to 0.005, no test significant after correcting for eight tries, and the sign flipping between halves of the data in six of eight. We found no edge in one measure of attention; that's not proof that no attention signal exists.
Cousin Kevin has a theory. "When a company is suddenly all over the internet, something's about to happen. I just have to be early." His plan is to watch which companies people are reading about, and buy before the crowd.
Aunt Linda asks how he'll know the crowd isn't reading about it because something has already happened. Kevin says that's a pessimistic way to look at it. It's also the question we tested.
What we tested
- Attention: daily page views of each company's English Wikipedia article, for 491 US stocks where the article could be matched without doubt, from 2016 to 2026. Page views were shifted by a day, so we only used numbers you'd really have had in time.
- Four ways to measure a jump: last week's views against the last four weeks; how unusual today's views are for that company; the jump left over after removing what the stock's own recent price move would explain; and the jump combined with that recent move.
- The outcome: each stock's return over the next 5 and 10 trading days, compared with the average of all 491 stocks. That takes the market's own ups and downs out of the picture.
- The score: every day, rank the stocks by attention and by what they did next, and measure how well the two rankings match. Four measures times two horizons: eight tests.
- Two checks against luck: a placebo, where each stock's page views were shifted in time at random 300 times to see what pure chance produces, and a correction for having run eight tests.
The result
| What we measured | Result across the 8 tests |
|---|---|
| Average daily rank correlation with the next 5 or 10 days | 0.002 to 0.005 |
| Strength of the evidence (t-statistic) | 0.7 to 1.2 (2 is the usual minimum) |
| Best result against the placebo | p = 0.09 |
| After correcting for 8 tests | p of 0.72 or more |
| Tests where the sign flipped between the two halves of the data | 6 of 8 |
A rank correlation of 0.005 means that knowing which stocks were suddenly popular told us almost exactly nothing about which would do better next. The best of the eight versions was the kind of result chance produces about one time in eleven, and once you remember that we tried eight versions, even that disappears. In six of the eight, the direction of the tiny link was different in the first and second halves of the data: attention looked slightly good in one half and slightly bad in the other.
Why Kevin is late, however early he is
People mostly read about a company because something happened: results, a lawsuit, a new product, a crash. The price reacts to that news within minutes. The page views pile up over the following hours and days. So a jump in attention is mostly an echo of news that is already priced in. By the time the crowd is reading, the move it's reading about has usually happened.
Statistics for noobs: why the placebo matters
With 491 stocks and ten years of daily data, some link will always appear by chance. The placebo answers "how big a link does pure chance produce here?" by breaking the timing between attention and returns on purpose, many times, and looking at the results. If the real result doesn't stand out from the placebo results, it's not evidence.
The correction for multiple testing answers the other question: if you try eight versions, how good does the best one have to be before it means something? Here, much better than anything we found.
The moral
Kevin's theory was right about one thing: attention follows events. It just follows them, it doesn't lead them. Linda has pointed out that a crowd reading about a stock is the financial version of a crowd gathering after an accident. Kevin has stopped watching page views. He now watches what people are watching about page views, which we haven't tested, and don't plan to.
Every test on this site is judged against a random stock and the market. This one didn't get that far: the signal wasn't there to trade.
What this test can't tell you
- One source of attention. We used Wikipedia only. Search-engine data and social media weren't tested here.
- Daily data, 5 and 10 days ahead. Very fast effects within the same day weren't measured.
- US stocks listed today, which brings survivorship bias: companies that disappeared are missing.
- No trading test. With no signal before costs, there was nothing to turn into a strategy.
- Absence of evidence. "We found no edge" isn't proof that attention never matters.
Statistical tests on historical data, not real trades. Daily Wikipedia page views and daily prices of 491 US stocks listed today, 2016 to 2026. Historical results do not guarantee future returns. This is educational content, not financial advice.