Corporate life · Multiple testing
Why Some KPI on the Dashboard Is Always Red
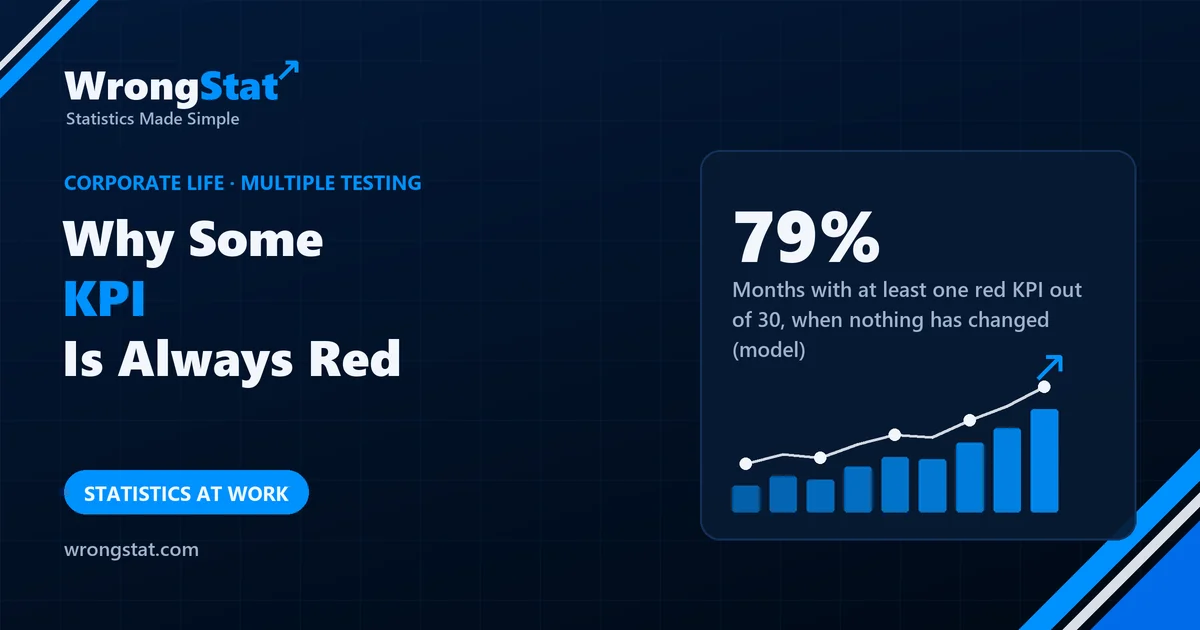
The short version: if each KPI has a 5% chance of turning red in a normal month, a dashboard of 30 KPIs shows at least one red in 79% of months with nothing changing, 1.5 reds on average, and only about 2.6 fully green months a year. In 55% of years, some KPI is red two months in a row, which looks like a trend. That's multiple testing: the more things you check, the more false alarms you get. The fix is fewer, stricter alarms, and looking for patterns that persist.
Monthly business review. The dashboard has 30 KPIs, each with a traffic light. Green: inside its normal range. Red: outside it. This month, two are red: average handling time and customer complaints in the north region. The meeting spends 50 minutes on them.
Last month a different KPI was red. The month before, two different ones. Kevin has never seen a month with all 30 green and wonders whether one exists.
How often should something be red?
Suppose each KPI's "normal range" is set so that in an ordinary month, with nothing changing, it falls outside 5% of the time. That's a reasonable alarm for one KPI: a red light is unusual. But the dashboard checks 30 of them every month.
| Number of KPIs | Months with at least one red, nothing changing |
|---|---|
| 1 | 5% |
| 5 | 23% |
| 10 | 40% |
| 30 | 79% |
| 50 | 92% |
With 30 KPIs, a normal month has 1.5 red lights on average, and a year has only about 2.6 fully green months. The meeting always has a crisis to discuss, and it's usually noise.
Months with at least one red KPI when nothing has changed
The fake trend
One red month is easy to dismiss. Two in a row feels like a pattern. But across 30 KPIs and 12 months, our simulation found that some KPI is red two months running in 55% of years, by chance alone. Any single KPI turns red at least once in a year 46% of the time.
This is multiple testing: each check has a small chance of a false alarm, and many checks add up to a near certainty that something will light up.
How to make red mean something
- Fewer KPIs. Keep the handful that drive decisions; report the rest without traffic lights.
- Stricter alarms for big dashboards. With 30 KPIs, a 1-in-600 threshold for each keeps the chance of any false red in a month near 5%.
- Look for persistence. Three or more months in the same direction, or a change that shows up in related KPIs at once, is far more likely to be real.
- Write down why before you look. A KPI you expected to move, for a stated reason, is a test; one you notice afterwards is a search.
Statistics for noobs: count your chances
Before reacting to a surprising number, ask how many numbers you looked at to find it. One surprise among 30 checks is expected. The chance that at least one of n independent checks raises a false alarm is 1 minus 0.95 to the power n, which passes 50% at 14 checks.
Where it costs you money
Scan 30 indicators every morning and one will always be "flashing a signal". Scan 500 stocks for an unusual pattern and dozens will have one. The more you screen, the stricter the bar has to be before you act.
The moral
Kevin proposed cutting the dashboard to eight KPIs. The proposal was welcomed and sent to a working group, which consulted every department. Each department added the KPIs it cared about. The new dashboard has 41 KPIs. Last month, three were red. The meeting has been extended to two hours.
What this model can't tell you
- KPIs aren't independent. Real ones move together, which changes the exact numbers: fewer separate alarms, but alarms that come in clusters.
- The 5% is our assumption. Many dashboards set thresholds by feel, which can make false alarms more or less common.
- Real problems happen. A red light can be real; the point is that you can't tell from the colour alone.
The business review and the dashboard are an illustration. The figures come from our own model of 30 independent KPIs, each with a 5% chance of a red month with nothing changing, simulated over 200,000 years. Educational content, not business or financial advice.