Myth #16 · Day of the week
Does Turnaround Tuesday Work? We Tested Buying Stocks After a Bad Monday.
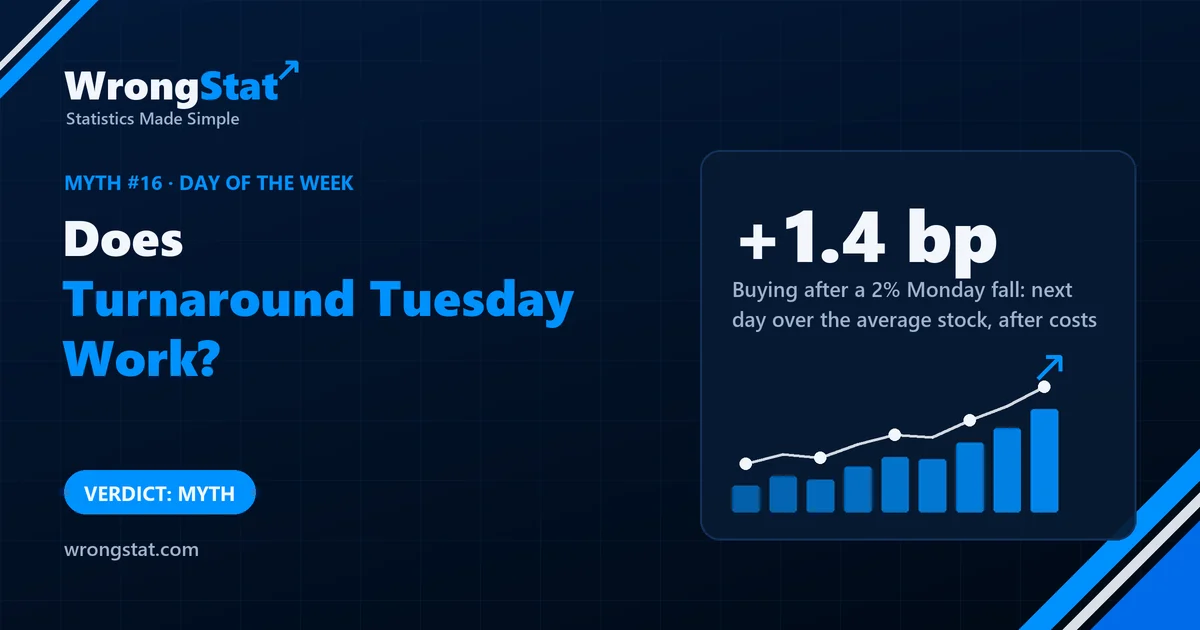
Verdict: myth, for individual stocks. On 581 US stocks from 2010 to 2026, buying after a Monday fall and selling a day later beat the average stock by 1.0 to 6.4 basis points before costs, and by between -1.2 and +1.4 after. The same signal on other weekdays did as well, then reversed after 2020, so Monday isn't special. A faint market-level trace after weak Mondays was on the edge of chance. We found no usable edge; that's not proof that none exists.
Uncle Gary has a Monday ritual. If one of his stocks has a bad Monday, he buys more at the close. "Turnaround Tuesday," he explains, tapping his nose. "Everyone panics on Monday, everyone calms down on Tuesday. Free money."
Aunt Linda points out that he also panics on Monday, and also calms down on Tuesday, and that the money has never once been free. So we checked whether Tuesday is doing anything at all.
What we tested
- The trade: buy a stock at Monday's close if it fell that day, sell at the close of the next trading day.
- Three sizes of fall: any fall, a fall of 1% or more, and a fall of 2% or more.
- The comparison: each stock's next-day return against the average of all 581 stocks on the same day. That removes the market's own moves, so we measure only the bounce.
- Costs: 0.05% per round trip.
- The control: exactly the same signal on Tuesdays, Wednesdays and Thursdays. If Monday is special, it should beat them.
- The data: 581 US stocks, daily prices from 2010 to 2026, split before and after 2020.
The result for individual stocks
| Stock fell on Monday by | Next day, over the average stock | After costs |
|---|---|---|
| Anything | +1.0 basis points (p = 0.39) | below zero |
| 1% or more | +3.8 basis points (p = 0.055) | -1.2 |
| 2% or more | +6.4 basis points (p = 0.045) | +1.4 |
A basis point is a hundredth of a per cent. The biggest bounce, after a fall of 2% or more, was 6.4 of them: 0.064%. After costs, 0.014%. And even that didn't hold up in each half of the data on its own (p = 0.11 before 2020, 0.22 after).
Then the control. The same signal on a Tuesday, buying after a Tuesday fall, gave +5.2 basis points before 2020 (p = 0.04), about the same as Monday, and then -7.6 from 2020. So Monday isn't special. What we're seeing is the ordinary tendency of a stock that drops sharply to bounce a little the next day, whatever the day is called, and that tendency is about the size of the trading costs.
Buying a stock after a Monday fall: next day vs the average stock
The one trace: the whole market
We also looked at the market as a whole. After a weak Monday for the market, an equal-weighted basket of all the stocks gained 19.8 basis points on Tuesday, against 6.3 on other days. That's a difference of 13.5 basis points across 362 weak Mondays, with a t of 1.94: right on the line where results start to count, and that's before allowing for the several tests we ran. It's a reason to look again with new data, not a reason to trade.
Statistics for noobs: test the same signal on another day
To show that a day of the week matters, you need the same rule on other days as a control group. Otherwise you can't tell a Monday effect from an effect that happens every day. Here the control did as well as Monday until 2020 and worse after it: the "Tuesday" in Turnaround Tuesday was just a name.
And always subtract the trading costs before celebrating. A bounce of a few basis points is real and still not worth trading if each round trip costs five.
The moral
Gary's Mondays aren't special. His stocks bounce a little after a bad day, like everyone's stocks, on every day of the week, by about what his broker charges. Linda suggested he could skip the ritual and get almost exactly the same result. Gary says the ritual is the point. We can't argue: we didn't measure rituals.
Every test on this site is judged against the average stock and against doing nothing. This one roughly matched both, after costs.
What this test can't tell you
- Daily closing prices. Buying at the open, or within the day, wasn't tested.
- The market-level trace was one comparison among several and wasn't corrected for multiple testing.
- US stocks listed today, which brings survivorship bias: companies that disappeared are missing.
- Absence of evidence. "No usable edge in our test" isn't proof that no day-of-the-week effect exists anywhere.
Statistical tests on historical data, not real trades. Daily prices of 581 US stocks listed today, 2010 to 2026, with 0.05% costs per round trip. Historical results do not guarantee future returns. This is educational content, not financial advice.