Myth #7 · Chart levels
Do Support Levels and Fibonacci Work? We Drew Random Lines Too.
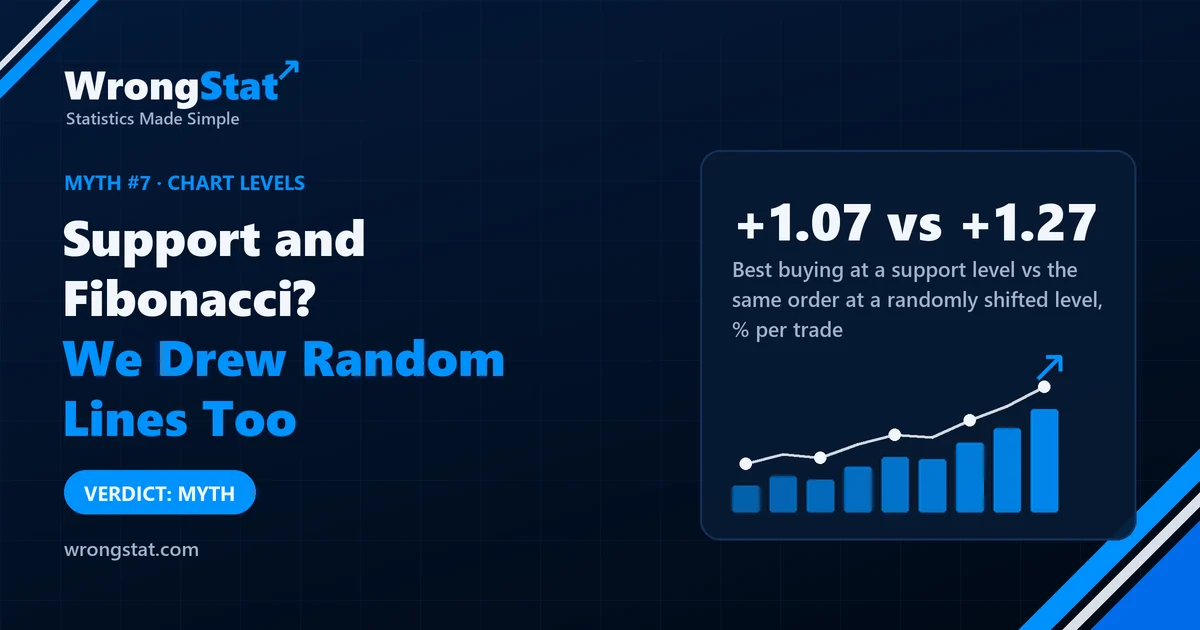
Verdict: myth. Prices bounced off Fibonacci levels no more often than off a naive guess, more overlapping levels didn't make a stronger barrier, and buying at support did no better than buying at a line shifted to a random nearby price. The only real effect we found was small: prices that stretch far from their 10-day average tend to drift back. It didn't make money once traded.
Uncle Gary has discovered support. He opens a chart, finds the price where the stock "always bounces", and draws a line. Then he adds Fibonacci levels: 38.2%, 50%, 61.8%. Where three of his lines meet, he says, the price has "nowhere to go".
Aunt Linda took the ruler, closed her eyes and drew her own lines. Gary said that's ridiculous, they're random. Linda said yes, that's the point. She wanted to know whether his lines did better than hers.
So we did Linda's test, properly, on about 580 stocks.
What we tested
- The levels: Fibonacci retracements (five ratios over five window lengths, 25 levels a day), moving averages from 10 to 200 days, support and resistance from previous swing highs and lows, Bollinger bands, Donchian channels, daily, weekly and monthly pivot points, and VWAP. Seven families in all.
- The data: daily prices for about 580 US stocks, 2010 to 2026, split by date into separate periods for building, checking and final testing, so nothing was tuned on the data it was judged on.
- Three questions: does the price bounce at the level more often than elsewhere? Do several levels in the same place make a stronger barrier? And does buying at the level make money compared with buying at a random nearby price?
What we found
Fibonacci levels: no better than a guess. When a Fibonacci zone was below the price, the price held there within five days 51.9% of the time. A naive guess did 52.4%. We even let a computer search history for the best possible level for every stock, the most overfit "perfect" line it could find, and then tested it on later years: 52.7%. Above 50% isn't the level working; it's the market drifting upwards.
Where lines meet, nothing special happens. Zones where several Fibonacci levels overlapped were, if anything, very slightly less likely to hold (the link was tiny, below 0.006 on a scale where 1 is perfect). For support and resistance from old highs and lows, more levels in one place made the price slightly less likely to even reach the zone.
Linda's random lines did just as well. This was the decisive test. We placed buy orders at the lower Bollinger band and at pivot supports, with costs and fixed exits, and compared them with the same orders placed at a level shifted 0.6 ATR (a fraction of a typical day's move) up or down.
| Final test period, per trade | Result |
|---|---|
| Buy at a support level (Bollinger band, pivot support) | +0.77% to +1.07% |
| Same order at a randomly shifted level | +0.73% to +1.27% |
| Sell at a resistance level | -0.29% to -0.06% |
Buying dips made money in a market that mostly went up. The level itself added nothing: the shifted line was as good, and the deeper shifted line was often better. Selling at resistance lost money once costs were counted. Splitting the years into calm, volatile, rising and falling markets didn't rescue any level either.
Final test period, result per trade (%)
The one thing Gary got half right
There was one small, real effect. When a price stretched far from its 10-day average, by 1.5 to 2 times a typical day's move, it was about 4.4 percentage points more likely to come back and touch the average within ten days than to touch a level the same distance on the other side. Prices that run too far do tend to drift back a bit.
But touching isn't profit. When we traded it with costs and stops, selling the stretch lost money in every period, and buying it couldn't be told apart from a simple comparison in one of the two test periods. A real wobble, not a strategy.
Statistics for noobs: why lines look magic on a chart
Draw any line on a chart and the price will touch it eventually, and sometimes turn there, because prices turn all the time. You'll remember the turns and forget the times the price sailed straight through. That's cherry-picking with a ruler.
The fix is a control: put a line at a random nearby price and see whether yours does better. If it doesn't, the line was decoration. In our data, it didn't.
The moral
Gary looked at the results for a long time and said the problem is that 580 stocks is too many: the levels work best on the charts he looks at personally. Linda agreed that this is exactly how it works.
Linda's lines are now framed in the hallway. Gary walks past them twice a day. They have the same track record as his.
What this test can't tell you
- Hand-drawn levels. We calculated levels by fixed rules. A human picking "obvious" levels by eye might choose differently, though that can't be tested without the human.
- Not tested here: trendlines and channels, volume profile and intraday levels.
- A rising market. 2010 to 2026 mostly went up, which makes any buying look good; that's why we compare with a shifted level rather than with zero.
- Survivorship bias. We used stocks listed today, so companies that crashed through their support and disappeared are missing.
Simulations on historical data, not real trades. Daily prices of about 580 US stocks listed today, 2010 to 2026, with trading costs in the trade tests. Historical results do not guarantee future returns. This is educational content, not financial advice.