Myth #9 · Markets abroad
Does the Asian Market Predict the US Market? Tokyo and Hong Kong, Tested.
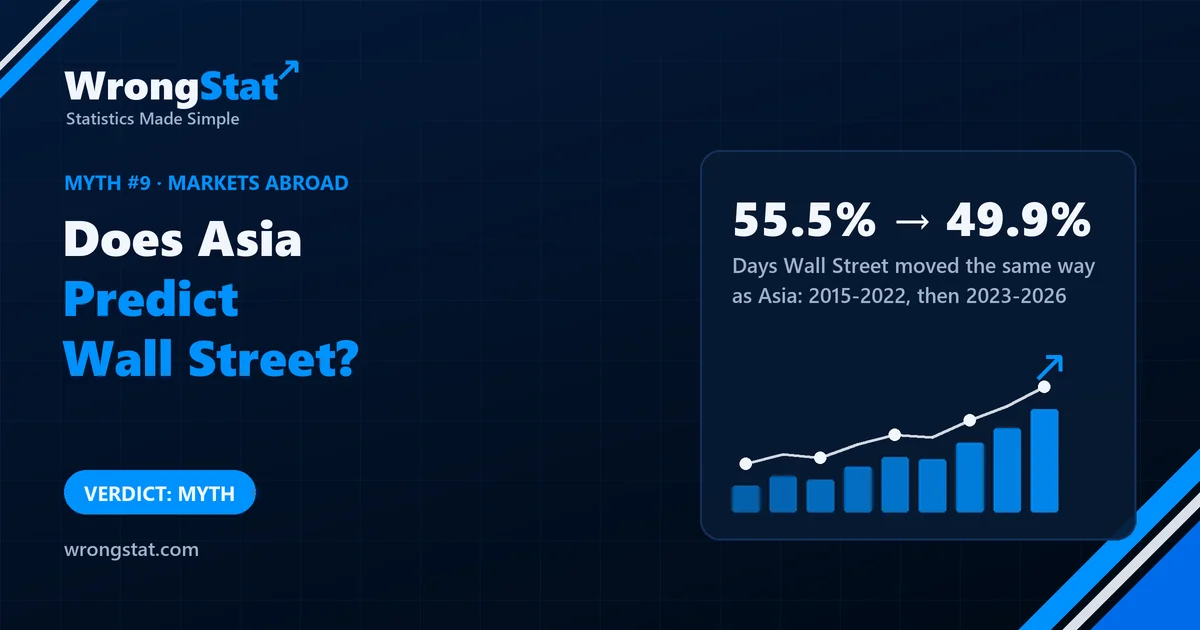
Verdict: myth, at least for anyone trying to use it. From 2015 to 2022 the US session moved the same way as Asia's on 55.5% of days, and even that came almost entirely from days when Asia rose. From 2023 to 2026 it was 49.9%, a coin toss. For 533 ordinary US stocks the next day, Asia told us nothing at all. We found no usable edge; that's not proof that no link of any kind exists.
Uncle Gary gets up at six, makes coffee and checks Tokyo. "Nikkei's down two per cent," he announces to Aunt Linda, who is not awake. "Wall Street's going to have a bad day." He says it with the calm of a man reading a weather forecast for a country he doesn't live in.
Some days he's right. He remembers those. Linda, once awake, asked how often he's wrong. Gary said that's not how markets work. So we counted.
What we tested
- Asia: the average daily session return (open to close) of the Nikkei 225 in Tokyo and the Hang Seng in Hong Kong. Both close before New York opens, so this is information you really have in time; no peeking at the future.
- Wall Street: the same-day session of the S&P 500 and the Dow, and the next day's return for 533 ordinary US stocks.
- The data: January 2015 to September 2026, split by date: 2015 to 2022 to look for an effect, 2023 to 2026 to check whether it held. An effect has to appear in the first period and survive the second.
Question one: does Wall Street follow Asia the same day?
| US session moved the same way as Asia | 2015-2022 | 2023-2026 |
|---|---|---|
| All days | 55.5% of 2,010 | 49.9% of 933 |
| Days when Asia rose | 59.4% | 53.4% (not significant) |
| Days when Asia fell | 51.6% (not significant) | 46.4% (not significant) |
| Correlation | 0.15 | 0.015 |
In the first period there was something, and it was lopsided: when Asia rose, the US session rose a bit more often than not. When Asia fell, which is the day Gary actually warns about, the US session was close to a coin even then. In the second period the whole thing disappeared. 49.9% is not a weak signal. It's the absence of one.
Days the US session moved the same way as Asia
Question two: does Asia tell ordinary stocks anything about tomorrow?
Gary doesn't own the S&P 500. He owns a few stocks. So we checked whether Asia's move today said anything about the next day for 533 ordinary US stocks, after accounting for what the US market itself did today.
- 2015 to 2022: correlation 0.001. Same direction as Asia on 50.2% of 2,010 days.
- The share of stocks rising the next day was 52.2% after an Asian up day and 52.2% after an Asian down day. Not similar. Identical.
- In 2023 to 2026 a small link appeared (correlation 0.08), but a sturdier test of the whole distribution didn't confirm it, and it was missing from the period where we looked for it first.
For the big indices alone, Asia today had a small link with tomorrow that grew in the later years. It explained between 0.3% and 1.6% of the day-to-day movement, it didn't carry over to ordinary stocks, and we didn't test it as a trade with costs. A signal that turns up only in the second half of the data, after you stop looking for it, is a reason to keep watching, not a reason to trade.
Why Gary is often right and still can't use it
Here's the catch. On a bad morning in Asia, US stocks often open lower. Gary sees red on his screen at 9:30 and feels vindicated. But that move happened overnight, before anyone could buy or sell at the previous close. The news is priced in by the opening bell. What we tested is the part you could still trade, the session after the open, and the next day. There, Asia's head start was gone.
It's the same reason a weather forecast for yesterday is always accurate.
Statistics for noobs: the second half of the data
Find a pattern in some years of data, then check it on years you didn't look at. That's called an out-of-sample test, and it's the single most effective way to kill a market legend. Patterns found by searching are partly luck, and luck doesn't repeat on new data.
The opposite order doesn't count. If something shows up only in the later data, it may be real, or it may be the next piece of luck. You'd need fresh data after that to know.
The moral
Gary still checks Tokyo every morning. He says it helps him prepare emotionally. We can't argue with that, because we didn't measure emotions. Linda checks the weather, which at least affects whether she needs an umbrella.
Every test on this site is judged against the S&P 500 and a random stock bought on the same day. This one never got that far: the signal didn't survive the step before.
What this test can't tell you
- Two Asian markets. We used Tokyo and Hong Kong. Other markets, or one sector at a time, might behave differently.
- Daily data. We didn't look at the first minutes after the opening bell, where any spillover would be fastest.
- No costs, no trading test. We stopped at whether a signal exists. Nothing reached the point of a strategy.
- Absence of evidence. "We found no usable edge" isn't proof that markets are unconnected; they clearly are, mostly through the opening price.
Statistical tests on historical data, not real trades. Daily index and stock prices, 2015 to 2026; the 533 stocks are US stocks listed today. Historical results do not guarantee future returns. This is educational content, not financial advice.