Are Job Interviews Effective? What a Correlation of 0.19 Means
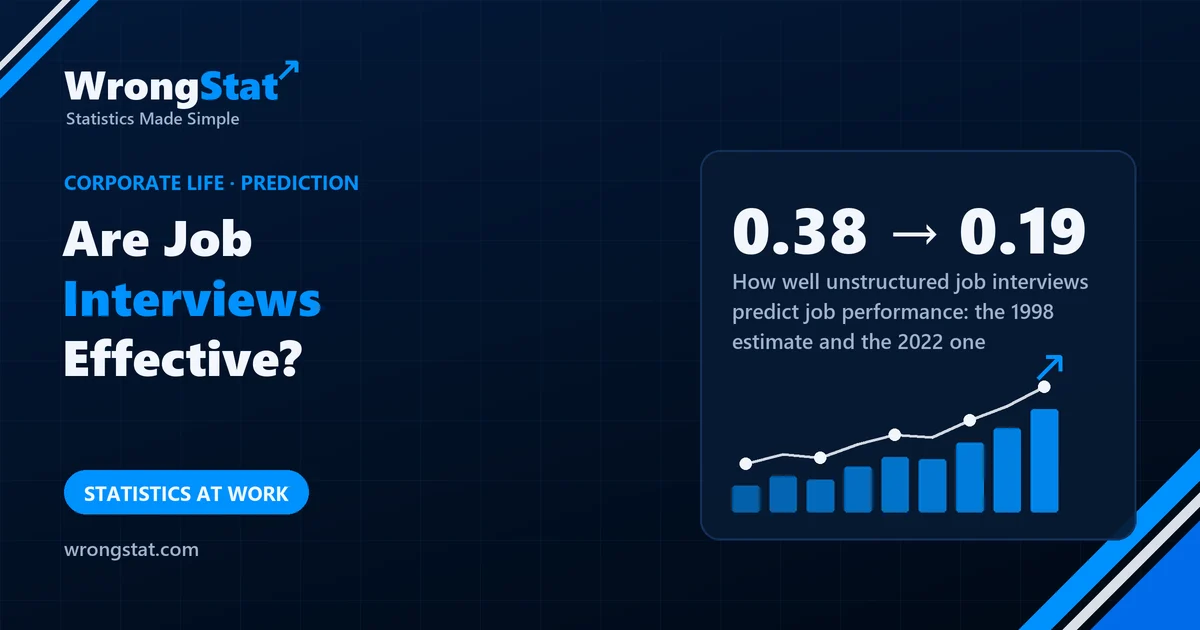
The short version: interviews help, but much less than interviewers think. A 2022 re-analysis of decades of studies found that a free-form, unstructured interview correlates with later job performance at about 0.19, down from an older estimate of 0.38; structured interviews, with the same questions and a scoring guide for every candidate, came top at 0.42. In our simulation of picking the best of ten candidates, a 0.19 interview finds the truly best person 16% of the time (a coin would manage 10%) and hires someone from the bottom half 38% of the time. A structured interview does better: 25% and 24%.
Kevin has been asked to sit in on interviews. His boss conducts them. The questions are: "Tell me about yourself", "What's your biggest weakness?" and "If you were a kitchen appliance, which one would you be, and why?"
The boss says he can tell within five minutes whether someone is any good. He has been doing this for twenty years. When Kevin asked how he knows he's right, the boss said that the people he hires are mostly fine. Kevin asked about the people he didn't hire. The boss asked Kevin which kitchen appliance he would be.
How you'd check
To find out whether interviews work, you score candidates, hire them, wait, and then compare the interview scores with how well they actually did the job. The strength of that relationship is a correlation: 1 would mean the interview ranks people perfectly, 0 would mean it's a coin toss. Psychologists call it the method's predictive validity, and there are decades of studies measuring it.
In 2022, a team of researchers re-examined the best-known summary of those studies, from 1998, and found that its statistical corrections had been too generous. Most numbers came down:
| How you pick people | 1998 estimate | 2022 estimate |
|---|---|---|
| Structured interview | 0.51 | 0.42 |
| Job knowledge test | 0.48 | 0.40 |
| Work sample (doing a piece of the job) | 0.54 | 0.33 |
| General ability test | 0.51 | 0.31 |
| Unstructured interview | 0.38 | 0.19 |
| Years of experience | 0.18 | 0.07 |
The correction matters because companies only see how hired people perform, never the rejected ones. The old method adjusted for that missing group and, the 2022 team argued, adjusted too much.
What 0.19 means in practice
A correlation is hard to feel, so we simulated it: ten candidates, the one with the best interview score gets the job, repeated 400,000 times.
| Interview that correlates with performance at | Hires the truly best of ten | Hires someone from the bottom half |
|---|---|---|
| 0 (a coin) | 10% | 50% |
| 0.19 (unstructured) | 16% | 38% |
| 0.42 (structured) | 25% | 24% |
| 1 (perfect) | 100% | 0% |
So the free-form interview is better than a coin, and a lot closer to the coin than to the boss's confidence. Squaring the correlation gives another way to see it: 0.19 squared is about 0.04, so the interview accounts for roughly 4% of the differences in how people go on to perform.
Chance of hiring the truly best of ten candidates
Why structure helps
A structured interview asks every candidate the same job-related questions, in the same order, and scores the answers against an agreed guide, often with more than one interviewer. That removes much of the noise: the mood of the day, the small talk about football, the candidate who reminds the boss of himself at 25. Less noise in the score means a higher correlation with the job. It's the same reason a ruler beats eyeballing.
Statistics for noobs: confidence isn't validity
An interviewer never finds out how the rejected candidates would have done, and the hired ones are "mostly fine" because most people are mostly fine. That feedback can't tell a 0.19 method from a 0.9 method. The only way to know is to write the scores down, then compare them with performance later.
Where it costs you money
Choosing a fund manager or an adviser because they "came across well" is an unstructured interview with your savings. A track record compared with a fair benchmark, over a long period, is the structured version.
The moral
The boss hired the candidate who said "toaster", because it showed decisiveness. Kevin suggested trying a structured interview next time. The boss agreed and asked Kevin to draft a standard list of questions. The list was approved after one change: question 7, "If you were a kitchen appliance, which one would you be?", with a scoring guide. A toaster scores 5.
What this can't tell you
- Averages hide variety. The figures average many jobs and studies; for some jobs an interview predicts better, for others worse.
- Performance is mostly a manager's rating. Those ratings are noisy too, which pulls every correlation down.
- Our simulation is a model. It assumes normal distributions and ten similar candidates; real shortlists are already filtered.
- Experts disagree on the corrections. The 2022 estimates are lower than the old ones, and the debate about the right adjustment continues.
Kevin, his boss and the toaster are an illustration. The validity figures come from the published re-analysis (Journal of Applied Psychology, 2022), compared with the 1998 summary it revised. The hiring percentages come from our own simulation of 400,000 rounds with ten candidates. Educational content, not career, legal or financial advice.