Myth #19 · Positioning
Does the COT Report Predict the Stock Market? We Tested 717 Weeks of S&P 500 Futures Positions.
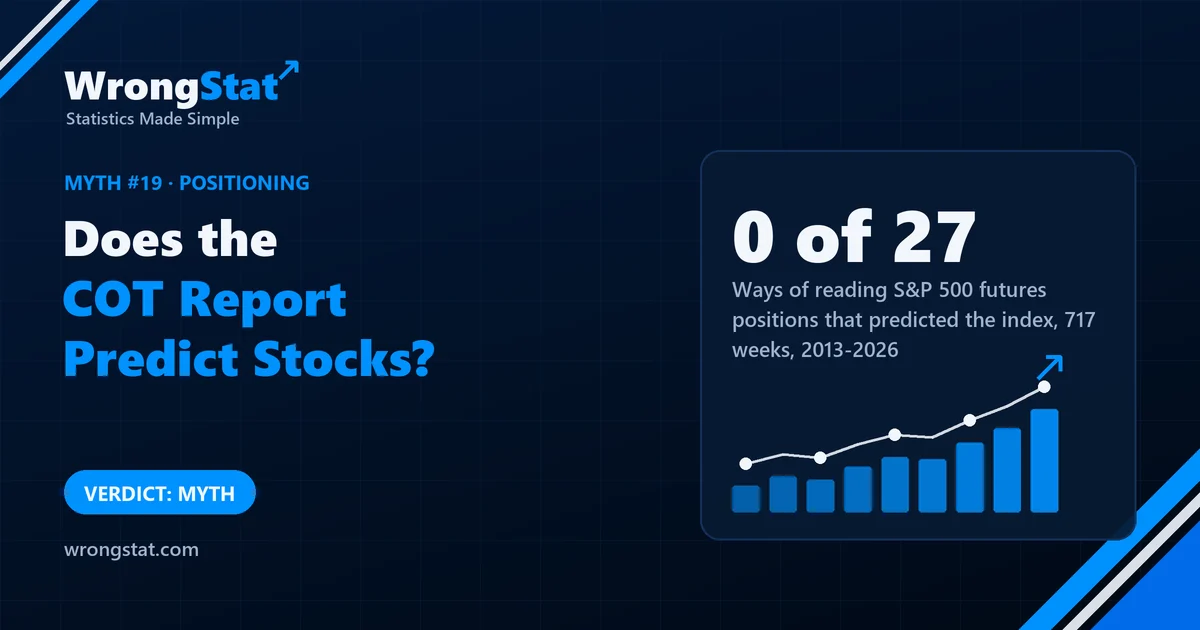
Verdict: myth, for the S&P 500. Across 717 weekly reports from 2013 to 2026, how leveraged funds, asset managers and dealers were positioned in S&P 500 futures told us nothing reliable about the index over the next 1, 4 or 12 weeks: the strongest of 27 links was 0.099, none was significant, and some flipped sign between the halves of the data. Other futures markets weren't tested. We found no signal; that's not proof that none exists.
Uncle Gary has discovered the COT report. Every Friday he downloads it, opens a spreadsheet and announces what "the smart money" is doing. "Hedge funds are net short," he said last month. "Something's coming." The market went up. He said the hedge funds were early.
Aunt Linda asks how often the smart money is early. Gary says that's what makes it smart. We checked the spreadsheet.
What we tested
- The report: the weekly Commitments of Traders data published free by the US futures regulator, for S&P 500 futures, January 2013 to September 2026: 717 weeks.
- Three groups of traders: leveraged funds (mostly hedge funds), asset managers and dealers.
- Three ways to read them: how net long or short the group was (relative to all open contracts), how much that changed over 4 weeks, and how unusual it was compared with that group's own past.
- Three horizons: the S&P 500 over the next 5, 20 and 60 trading days (about 1, 4 and 12 weeks).
- No peeking: the report describes Tuesday's positions but is published on Friday, so each signal was only used from the Friday it became available. Overlapping periods were accounted for when judging significance.
- Stability: every link was checked separately in the first and second halves of the data.
The result
| 27 combinations, 2013-2026 | Result |
|---|---|
| Strongest link with the next S&P 500 return | 0.099 (leveraged funds, 4-week change, 12 weeks ahead) |
| Strength of that link (t-statistic) | 0.69 (2 is the usual minimum) |
| Combinations that were statistically significant | 0 of 27 |
| Asset managers' positioning, 12 weeks ahead | -0.285 in the first half, +0.062 in the second |
| Dealers' positioning, 12 weeks ahead | +0.256 in the first half, -0.062 in the second |
The strongest link was weak and, measured honestly for overlapping periods, nowhere near significant. Some links looked substantial in one half of the data and then reversed in the other: asset managers' positioning went from a fairly strong negative link to a small positive one. A signal that changes direction depending on which years you look at isn't telling you about the future. It's describing the past it was fitted to.
Why the smart money isn't a signal
Many futures positions are hedges and housekeeping. An asset manager who is long S&P 500 futures may simply be investing new cash; a dealer who is short may be balancing what clients bought. By the time the numbers are published, three days late, the market has moved on. "Smart money" positions describe what big players needed to do, not what they know is coming.
Statistics for noobs: overlapping windows fool you
When you compare each week's report with the next 12 weeks of returns, consecutive comparisons share 11 of their 12 weeks. They aren't independent, so ordinary statistics think you have far more evidence than you do. We corrected for that by counting only the truly independent pieces. Without the correction, weak links look much stronger.
And always check stability: a correlation that flips sign between halves of the data is noise wearing a suit.
The moral
Gary still downloads the report every Friday. He now reads it to learn what the smart money did last Tuesday, which it is excellent at telling him. Linda has pointed out that the smartest money in the house is the money he didn't move because of the spreadsheet.
Every test on this site is judged against the market. Here the question was whether the report could predict the market at all, and in 27 tries it couldn't.
What this test can't tell you
- One market. We tested S&P 500 futures only. Reports for currencies, commodities and bonds weren't tested.
- Weekly data, 1 to 12 weeks ahead. Shorter or much longer horizons weren't tested.
- Simple readings. Other ways of combining the numbers might behave differently.
- Absence of evidence. "No signal in our test" isn't proof that positioning data never carries information.
Statistical tests on historical data, not real trades. Weekly Commitments of Traders data for S&P 500 futures and daily S&P 500 prices, 2013 to 2026. Historical results do not guarantee future returns. This is educational content, not financial advice.