Corporate life · Variance explained
Is the 10,000-Hour Rule True? How Much Practice Really Explains
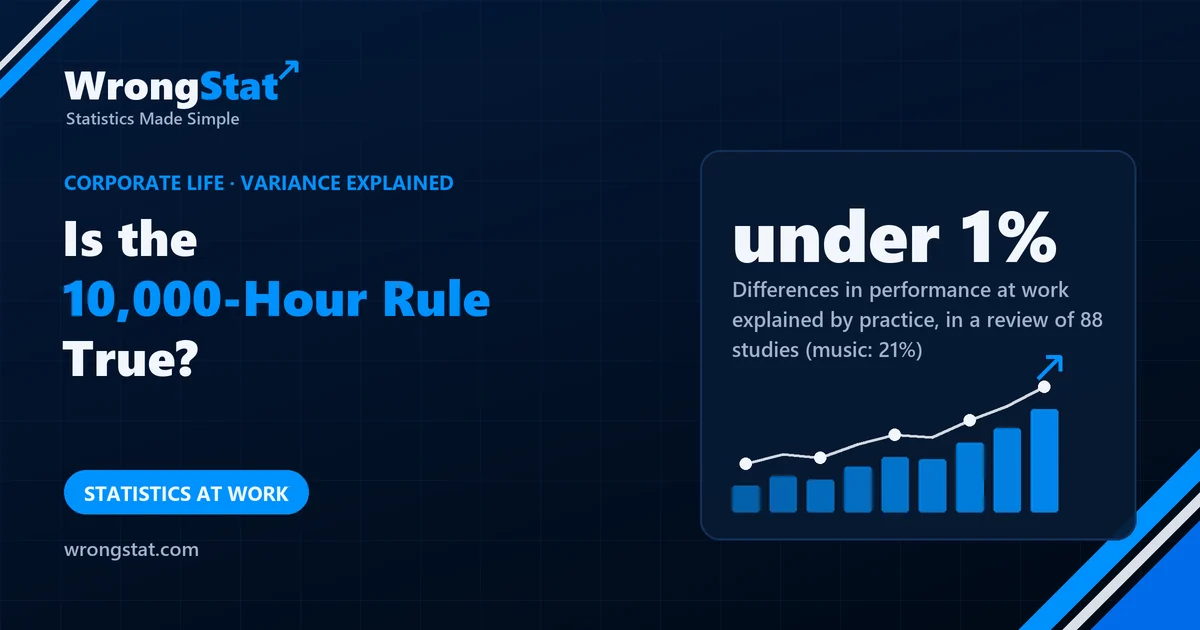
The short version: practice matters, but not as much as the rule suggests, and much less at work than in music or chess. The 10,000 figure is an average from a 1993 study of top violinists, not a threshold. A 2014 review of 88 studies found that deliberate practice explained about 12% of the differences in performance overall: 26% in games, 21% in music, 18% in sport, 4% in education and under 1% in professions. In our simulation of the professions figure, the 10% of people who practise most are in the top 10% for results only 13% of the time, barely above the 10% you'd get by chance.
HR has launched a new learning programme called Mastery10K. Every employee logs their practice hours in a spreadsheet. At 10,000, you become an expert. The programme is endorsed by a quote from a bestselling book.
Kevin calculated that at an hour a day he will be an expert in Excel in 27 years. His colleague in accounts is already on 9,400 hours of Excel, having used it every working day since 2003, and is still not allowed to touch the pivot tables.
Where the 10,000 comes from
In 1993 psychologists studied violin students at a top music academy in Berlin. By age 20, the best of them had practised on their own for an average of about 10,000 hours, well ahead of the students training to become music teachers. The researchers argued that long, focused, effortful practice, which they called deliberate practice, is what separates experts from the rest.
A bestselling book in 2008 turned the average into a rule: 10,000 hours to mastery, in anything. The original study had no such threshold. Some of the best violinists had practised much less than 10,000 hours, some much more, and the number was specific to violin students of that age.
How much does practice explain?
In 2014 a team of researchers pooled 88 studies that measured both practice and performance, in fields from chess to sales. They asked how much of the difference between people's performance could be accounted for by how much they had practised. In statistical language, that's the variance explained.
| Field | Differences in performance explained by practice |
|---|---|
| Games (chess, Scrabble and similar) | 26% |
| Music | 21% |
| Sport | 18% |
| Education | 4% |
| Professions | under 1% |
| All studies together | 12% |
So practice clearly matters in games, music and sport. At work, in these studies, it barely registered. That doesn't mean practice is useless at work; it means that the differences between people at work were mostly due to other things: ability, experience of the right kind, the job itself, luck, and how performance was measured.
Differences in performance explained by practice
What "explains 26%" means in practice
Variance explained is abstract, so we turned it into people. In our simulation, we took the 10% who practise the most and asked where they end up.
| Practice explains | Top 10% by practice who are top 10% by results | Top 10% by practice who are below average |
|---|---|---|
| 26% (games) | 33% | 16% |
| 4% (education) | 17% | 36% |
| Under 1% (professions) | 13% | 43% |
| 0% (pure chance) | 10% | 50% |
Even in chess, with the strongest link, two out of three of the hardest workers don't make the top 10%. In professions, the hardest workers are almost a random sample.
Statistics for noobs: variance explained
"Practice explains 12% of the variance" means: if everyone had practised exactly the same amount, the spread in performance would shrink by about 12%. It's the square of the correlation, so a correlation of 0.35 explains about 12%, and a correlation of 0.1 explains 1%.
It doesn't mean practice gives you 12% of your skill, and it depends on the group. Among complete beginners, practice may explain almost everything; among professionals who all practise a lot, it may explain little, because they hardly differ in practice.
Where it costs you money
Hours spent watching charts are practice too, and markets give poor feedback: you can practise a losing method for 10,000 hours and get very fluent at it. A trader's experience doesn't prove a strategy works. A test of the strategy on data it wasn't designed on does.
The moral
Mastery10K was reviewed after its first year. Logged hours were up 340%. Performance was unchanged. HR found a strong correlation between hours logged and hours available to log them, and has concluded that the most skilled employees are the ones with the least work. The programme has been extended.
What this can't tell you
- Experts disagree. The authors of the 1993 study argued that the 2014 review counted the wrong kind of practice. With stricter definitions, practice might explain more.
- Few studies in professions. The work figure rests on a small number of studies, so it's uncertain.
- Our table is a model. It assumes normally distributed practice and performance with the correlation implied by each figure.
- Practice still improves you. The review compares people with each other. Your own skill can rise a lot with practice even if practice doesn't explain who's best.
Mastery10K and the Excel colleague are an illustration. The figures come from the 1993 violin study (Psychological Review) and the 2014 meta-analysis of 88 studies (Psychological Science). The table of top performers comes from our own simulation of one million people. Educational content, not career or financial advice.