Myth #17 · All-time highs
Should You Buy Stocks at All-Time Highs? We Tested 6,000 Breakouts.
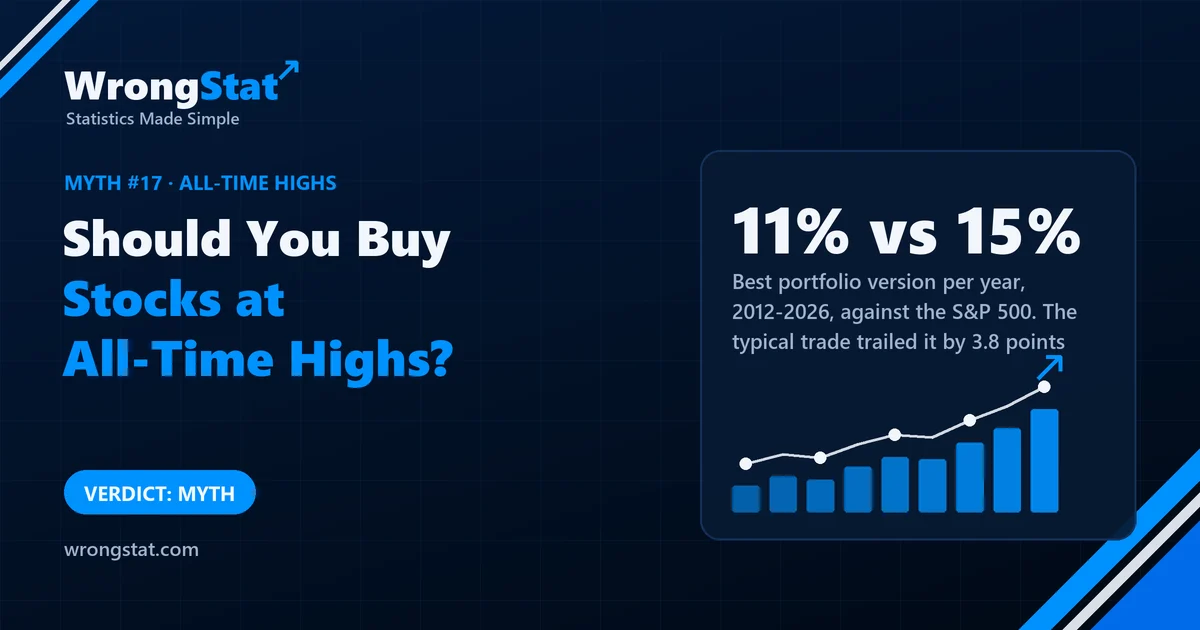
Verdict: myth, as a way to beat the market. Across about 6,000 trades from 2010 to 2026, buying US stocks at new highs beat the S&P 500 by 1.0 point per trade on average, a gap we can't tell apart from zero, while the typical trade trailed it by 3.8 points. As a portfolio with 5, 10 or 20 positions, every version grew more slowly than the S&P 500. The big winners the method promises exist; there just weren't enough of them. We found no edge; that's not proof that none exists.
Cousin Kevin has found a strategy on a trading forum, with screenshots. Buy a stock the day it closes at a new high. Sell if it falls below its 150-day average, and tighten that line as the profit grows. "Most trades lose a bit," he explains, "but every so often one goes up 200%, 300%, and that pays for everything."
Aunt Linda asks how often "every so often" is. The forum didn't say. So we counted.
What we tested
- The entry: a stock closes above its highest close of the past two years (or of all its history), and we buy at the next day's open. A second version also required the stock to have moved sideways in a narrow range for 60 days first.
- The exit: sell when the stock closes below its 150-day average. After a 50% gain the line moves up to the 100-day average, and after a 100% gain to the 50-day average, to lock in more of the winners.
- Costs: 0.2% each way.
- The comparison: the S&P 500 over exactly the same days as each trade.
- The data: about 560 US stocks listed today, daily prices from 2010 to 2026. About 6,000 trades.
- A real portfolio: the same signals, but with only 5, 10 or 20 positions at a time, picking at random when there were more signals than free places (20 different random runs), from 2012 to 2026.
Result one: trade by trade
| About 6,000 trades, 2010-2026 | Result |
|---|---|
| Average trade | +5.9% |
| S&P 500 over the same days | +4.9% |
| Average gap over the S&P 500 | +1.0 point (95% range -0.3 to +1.5) |
| Typical (median) gap | -3.8 points |
| Trades that made money | 43% |
| Trades that lost more than 10% | 14% |
| Trades that more than doubled | 1.0% |
| Share of all gains from the best 5% of trades | 42% |
The forum was right about the shape: lots of small and medium losses, rare huge winners. The 200% and 300% trades exist. They're about 1 in 100. The average trade beat the index by 1 point, but its range reaches below zero, and the typical trade lost 3.8 points to it. The version with the 60-day sideways range did worse (+0.1 points, range -1.4 to +0.2). And the small edge faded over time: +1.9 points before 2019, about zero after.
Result two: as a portfolio you could actually run
Trade-by-trade averages assume you can take every signal. Real money can't: on busy days there are more breakouts than cash. So we ran it as a portfolio, against an S&P 500 that grew about 15% a year over 2012 to 2026:
| Growth per year, 2012-2026 | 5 positions | 10 positions | 20 positions |
|---|---|---|---|
| New two-year high | 5.0% | 7.5% | 9.5% |
| New all-time high | 8.8% | 10.2% | 11.0% |
| Two-year high after a sideways range | 5.7% | 7.6% | 9.3% |
Every version grew more slowly than the S&P 500. The worst monthly fall ranged from 15% to 39%, bigger with fewer positions. And luck mattered a lot: with 5 positions, the 20 random runs ended anywhere from -0.4% to +9.3% a year, depending only on which signals happened to be picked on crowded days. (Cash earned nothing in this test, which flatters the index a little; the gap is too big for that to close it.)
Portfolio growth per year, 2012-2026: buying new highs vs the S&P 500
And does a new high predict more highs?
A separate test on 571 US stocks asked the simpler question. After a new all-time high, the next 20 days averaged 0.21 points worse than other stocks and the next 60 days 0.33 worse. Neither was statistically significant. A new high told us nothing reliable about what came next, in either direction.
Statistics for noobs: the median trade and the survivors
When a few huge winners pay for many losers, the average and the typical result tell different stories. Here the average looked slightly positive and the median clearly negative. Ask for both, and ask how much of the total comes from the top few percent.
And mind the survivorship bias: we tested stocks that exist today. Companies that hit new highs and then collapsed or disappeared aren't in the data, which flatters exactly this kind of strategy. The real result is probably a bit worse than ours.
The moral
The forum didn't lie. The screenshots of 300% winners are real; they're one trade in a hundred, shown a hundred times. Kevin worked out that he'd need about 100 trades to expect one, at 0.4% in costs each, while the index he's trying to beat costs almost nothing to hold. He has kept the strategy as a screensaver.
Every test on this site is judged against the S&P 500 after costs. This one, run as a portfolio, didn't get there in any version.
What this test can't tell you
- One set of rules. Other exits, filters or holding rules weren't tested.
- US stocks listed today: survivorship bias makes this kind of strategy look better than it was.
- Uninvested cash earned nothing in the portfolio test, which slightly understates the portfolios.
- Absence of evidence. "No edge in our test" isn't proof that buying new highs can never work.
Simulations on historical data, not real trades. Daily prices of about 560 US stocks listed today, 2010 to 2026, with 0.2% costs each way, compared with the S&P 500 over the same days; portfolio test 2012 to 2026 with no interest on cash. Historical results do not guarantee future returns. This is educational content, not financial advice.