Myth #13 · Breakouts
Does Buying Breakouts on Big Volume Work? We Tested a Five-Step Growth-Stock Checklist.
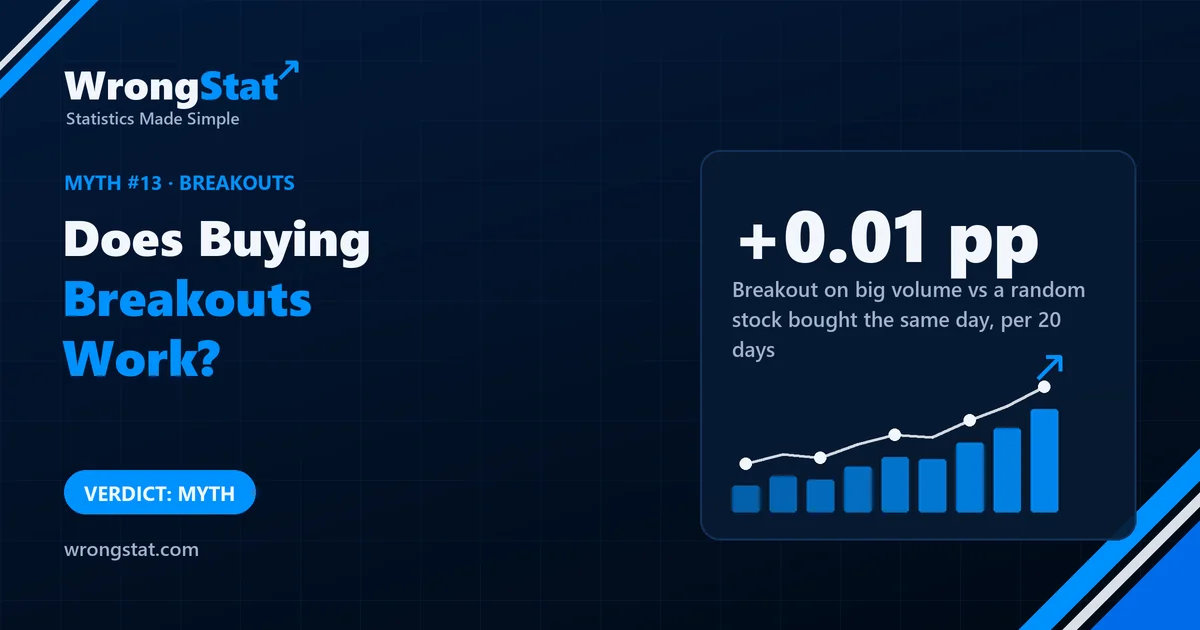
Verdict: myth, for the parts we could test. On 530 US stocks from 2010 to 2026, a breakout to a new 40-day high on heavy volume beat a random stock bought the same day by +0.01 points over 20 days. Adding market, trend and sector filters left it between +0.07 and +0.14; adding relative strength gave +0.36, with a range that still reached zero. The raw gains were mostly the market's normal drift. The checklist's earnings step couldn't be tested. We found no reliable edge; that's not proof that none exists.
Uncle Gary has printed a checklist from a trading forum and stuck it to the fridge. Step one: the market must be in an uptrend. Step two: the stock must be in a strong uptrend of its own. Step three: its sector must be beating the market. Step four: the stock must be one of the strongest performers. Step five: buy the day it breaks out to a new high, on heavy volume.
"Each step filters out the losers," he explains. "By step five, only winners are left." Aunt Linda asks how many winners were left last year. Gary says the checklist is for the long term.
What we tested
- The breakout: the first day a stock breaks out to its highest level in 40 trading days, on volume at least 1.5 times its 50-day average.
- The filters, added one at a time: the market in an uptrend (the S&P 500 above its 50-day average, and that above its 200-day average); the stock in an established uptrend of its own (the so-called second stage); its sector's typical stock beating the S&P 500 over 60 days; and the stock in the top 20% of all stocks by six-month return (relative strength).
- The trade: buy at the next day's open, hold for 20 trading days. Before trading costs, which can only make things worse.
- The control: a random stock bought on the same day, drawn 20 times for each trade. That removes the market's own drift, so we measure only what the checklist adds.
- The data: 530 US stocks, daily prices from 2010 to 2026. A 95% range for each result, from resampling the trading days (the bootstrap).
The result, layer by layer
| Checklist so far | Gain over a random stock, per 20 days | 95% range |
|---|---|---|
| Breakout on volume only | +0.01 points | -0.15 to +0.24 |
| + market in an uptrend | +0.08 points | includes zero |
| + stock in its own uptrend | +0.14 points | -0.03 to +0.48 |
| + strong sector | +0.07 points | includes zero |
| + relative strength (full checklist, 2,696 trades) | +0.36 points | -0.00 to +0.87 |
Not one row has a range that stays clear of zero. The breakout itself added nothing: +0.01 points over 20 days. The market filter, which sounds like the most sensible step, added almost nothing either.
That may be surprising, because the trades themselves gained about 1 point on average over 20 days. But a random stock bought on the same days gained nearly as much. That gain is the market's normal upward drift, available to anyone who simply owned stocks at the time. The checklist didn't create it; it rode it.
Gain over a random stock bought the same day, per 20 days
The one layer with a pulse
The last filter, picking stocks that had already risen most over six months, lifted the gap to +0.36 points. That's the closest thing to a result here, and it matches a known pattern called momentum. But its range still touches zero, and it changed between periods: +0.27 up to 2019 and +0.55 from 2020, both with ranges including zero. If anything works in this checklist, it's the part that has nothing to do with breakouts, and even that is weak.
The step we couldn't test
The original checklist also asks for fast-growing company earnings. Testing that properly needs each company's quarterly results as they were known at the time, and we don't have that history. So this test covers the price and volume steps only. It says nothing for or against the earnings step.
Statistics for noobs: compare with a random pick on the same day
A strategy that buys stocks in a rising market will make money in a rising market. That proves nothing about the strategy. The fair test is to buy a random stock on the same day and see whether the strategy does better. Here the random stock kept up almost perfectly.
And a confidence interval that includes zero means the data can't tell the result apart from nothing. Adding filters made each version sound more convincing, but none of them made the range stop touching zero.
The moral
Each step of Gary's checklist is reasonable. Put together, they produce a very careful way of buying the same thing as everyone else on the same day. Linda has suggested a sixth step: check whether a random stock would have done just as well. Gary says that would ruin the checklist. In a way, it does.
Every test on this site is judged against a random stock bought on the same day and the market. This one matched the random stock almost exactly, and its gains were the market's.
What this test can't tell you
- No earnings data. The checklist's earnings step wasn't tested.
- One version of each rule. Other breakout lengths, volume thresholds or holding periods might behave differently; we tested one sensible set.
- Before costs. Trading costs would push every row down.
- US stocks listed today, which brings survivorship bias: companies that disappeared are missing.
- Absence of evidence. "No reliable edge in our test" isn't proof that breakout trading can never work.
Simulations on historical data, not real trades. Daily prices of 530 US stocks listed today, 2010 to 2026, before trading costs, each trade compared with a random stock bought on the same day. Historical results do not guarantee future returns. This is educational content, not financial advice.