Productivity Up 40%. Nobody Knows What We Produce.
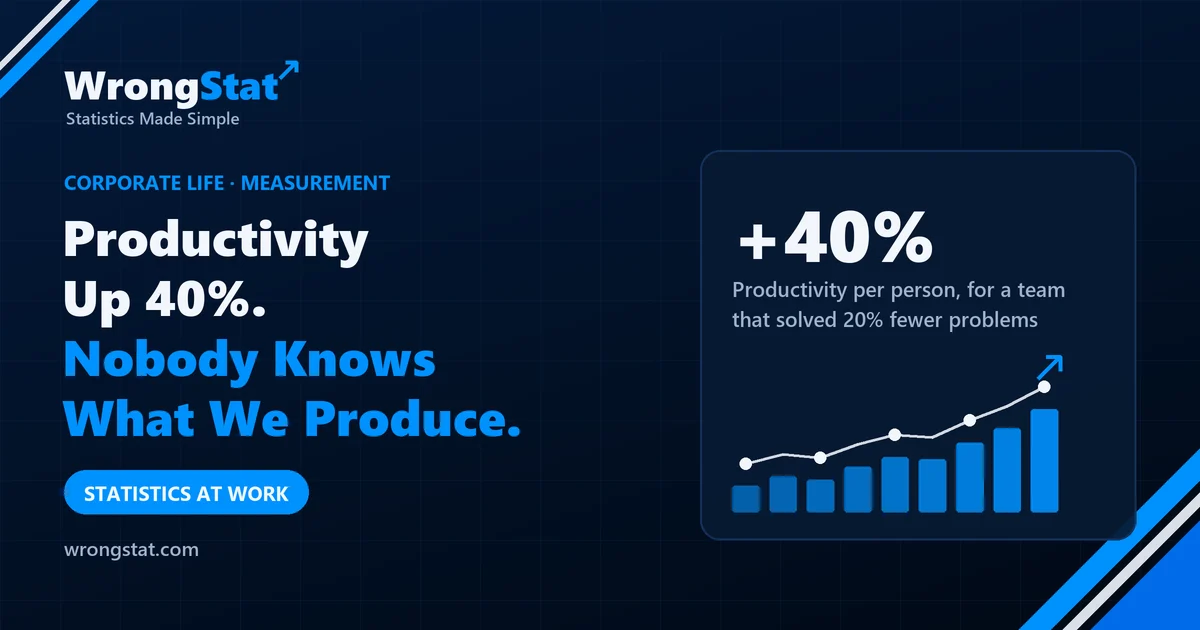
The short version: a productivity number is a fraction, and both halves can be moved without doing more work. Kevin's team lost two people and started splitting each problem into smaller tickets. Tickets per person rose 40%. Problems solved fell 20%. Every figure in the report was true, and the report was a lie.
The quarterly review opened with a slide that said Productivity +40% in a font normally used for movie posters. Cousin Kevin's team was named Team of the Quarter. There was cake.
Nobody asked what the team produces. It is a support team. It produces closed tickets. Whether anybody's problem was solved is a separate question, and separate questions are scheduled for next quarter.
What the number actually counts
"Productivity" here means tickets closed per person per week. That's a fraction: tickets on top, people underneath. Both halves moved.
| Last quarter | This quarter | |
|---|---|---|
| People on the team | 10 | 8 (two left, not replaced) |
| Problems solved per week | 500 | 400 |
| Tickets per problem | 1.0 | 1.4 (each problem now split into sub-tickets) |
| Tickets closed per week | 500 | 560 |
| Tickets per person (the KPI) | 50 | 70, up 40% |
| Problems solved per person | 50 | 50, up 0% |
| Problems solved in total | 500 | 400, down 20% |
Each person solves exactly as many problems as before. The team as a whole solves 100 fewer a week. If 500 new problems still arrive every week, the queue of unhappy customers grows by 100 every week. The slide did not mention the queue. The queue was not on the slide because the queue is not a KPI.
Two numbers from the same team
The word that changed meaning
Nobody lied. Nobody made up a number. The word "productivity" simply stopped meaning "useful work done" and started meaning "this fraction". That's the quiet trick: the label stays, the thing underneath it is replaced. Statisticians call the step from an idea ("useful work") to a number ("tickets per person") operationalisation, and it's where most corporate statistics go to die.
It's also Goodhart's law again: once tickets per person became the target, people did what targets always make people do. They found the cheapest way to move the number. Splitting a problem into three tickets is cheaper than solving three problems. We met this law before in How Many Meetings Could Have Been Emails? It hasn't changed. Neither has management.
How to check any productivity number
1. What's underneath? Every "per person" or "per hour" number is a fraction. Ask what happened to the bottom half. A smaller team makes almost any per-person figure look heroic.
2. What would the customer count? Find a number the team can't move by relabelling: problems that stayed solved, the length of the queue, how long people wait. If the KPI goes up while that number goes down, you're measuring the reporting, not the work.
Where it costs you money
Investment funds have the same fraction problem in reverse. "Assets under management up 40%" sounds like success, but it can come entirely from new customers paying money in, while the fund itself loses value. The number that matters to you is the return on each dollar, measured against the market. That's the one we use in every test on this site.
The moral
Management has noticed that productivity rises every time someone leaves. Two more positions are now under review. If the trend continues, the last person in the department will be the most productive employee in the history of the company, and the queue will reach the car park.
Kevin got a certificate. It's laminated. The customers did not get anything, but they are not a KPI.
The team and its numbers are an illustration, not data from a real company. The table assumes 500 new problems arrive every week in both quarters. Educational content, not financial advice.