Corporate life · Murphy's laws
Price's law: does the square root of the team really do half the work?
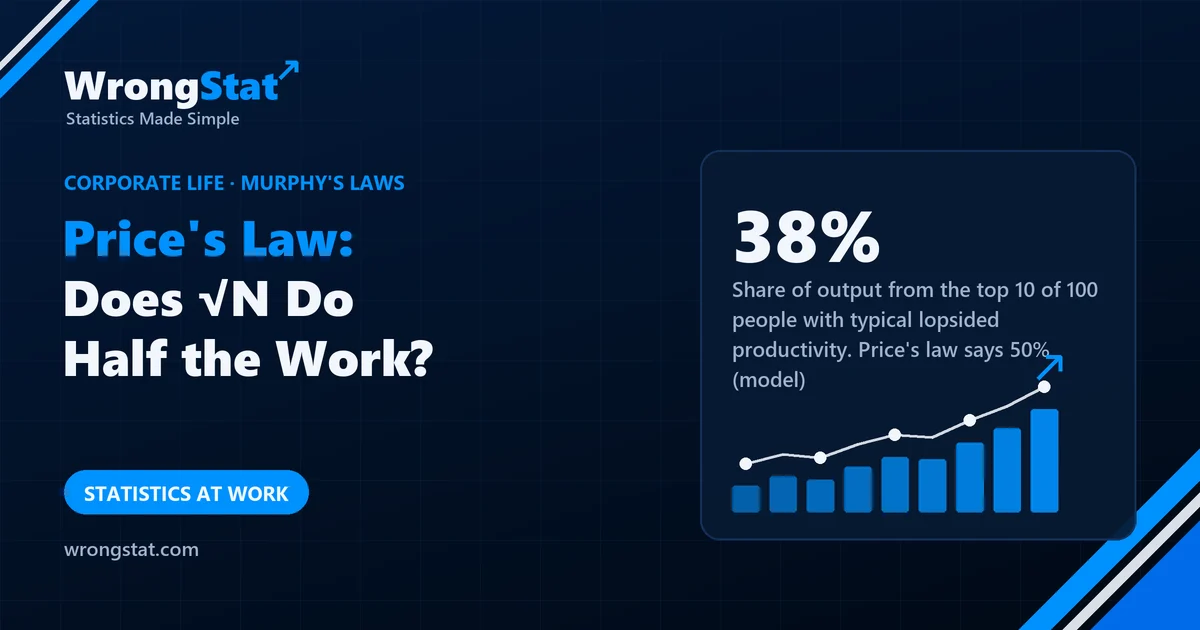
The short version: Price's law says half the output comes from the square root of the number of people: 10 out of 100, 100 out of 10,000. It comes from Derek de Solla Price's 1963 book on science, and even a 1976 paper he co-wrote found it doesn't match the data on scientists. In our model with typical lopsided productivity, the square root of the team does about half the work only around 25 people; at 100 it's 38%, at 10,000 it's 9%. Output is very uneven, but the share at the top doesn't shrink as neatly as a square root.
The consultant's slide has one sentence on it: "Price's law: √100 = 10 engineers do 50% of your work." The board is impressed. Someone asks which ten. The consultant suggests a "talent density review".
Kevin, who has the commit data, the ticket data and a free afternoon, decides to check.
The law
Derek de Solla Price, a physicist and historian of science, noticed in his 1963 book Little Science, Big Science that scientific output is very uneven: a few authors write most of the papers. He proposed that half of the papers come from the square root of the number of authors. Price's law has since escaped into management books and online threads about "who really does the work".
The unevenness is real. The square root is the problem. In 1976, Price and four colleagues published a paper in Social Studies of Science showing that the square-root rule doesn't fit with Lotka's law, the better-supported pattern for how many papers scientists write.
Checking it with a model
Output per person in most jobs is lopsided: most people produce a typical amount, a few produce several times more. A standard way to model that is a log-normal distribution, a form of skewness. We gave teams of different sizes log-normal output and measured what share the top √N people produced:
| Team size | Top √N people | Their share of output |
|---|---|---|
| 10 | 3 | 63% |
| 25 | 5 | 54% |
| 100 | 10 | 38% |
| 1,000 | 32 | 20% |
| 10,000 | 100 | 9% |
The square root does half the work at about 25 people and almost nowhere else. In big organisations the square root is far too small a group to carry half the load, however talented. The general point survives: the top 10% of a team often produces a third or more of the output. The neat formula doesn't.
Why the slide is risky
- Output isn't one number. Commits, tickets and papers measure some work and miss the rest: reviews, mentoring, fixing the thing nobody else understands.
- Top lists move. Who is top this quarter depends on projects and luck as well as skill; next quarter's list is different.
- The ten aren't independent. The most visible people often stand on work done by the other ninety.
Statistics for noobs: check a rule at more than one size
A rule like "the square root does half" or "20% do 80%" (the Pareto principle) is a claim about the shape of a distribution. The test is to check it at several sizes. If the share changes a lot as the group grows, the rule describes one size, not a law.
Where it costs you money
Stock market returns are also lopsided: a small share of stocks produces most of the long-run gains. That's a reason for owning broadly, not for believing a formula that tells you exactly how many winners there will be.
The moral
Kevin presented his table. The board agreed that productivity was uneven but that the square root was "a bit aggressive", and the talent density review was cancelled. The consultant has a new slide: "√(√100) ≈ 3 engineers do a third of your work." It's been very popular on social media.
What this model can't tell you
- Our distribution is a choice. More lopsided output pushes the shares up, more even output pushes them down; the drop with size remains.
- Measured output is not value. The table counts output units, not how much each one matters.
- Some fields are more extreme. In publishing or sales, a few stars can dominate more than this model shows.
The consultant, the board and Kevin's afternoon are an illustration. Price's law is from Derek de Solla Price, Little Science, Big Science (1963); the critique is from Allison, Price, Griffith, Moravcsik and Stewart in Social Studies of Science (1976). The table is our own simulation with log-normal output (sigma 1). Educational content, not business or financial advice.