Corporate life · Distributions
Is the 80/20 Rule True? What Happens When You Keep Applying It
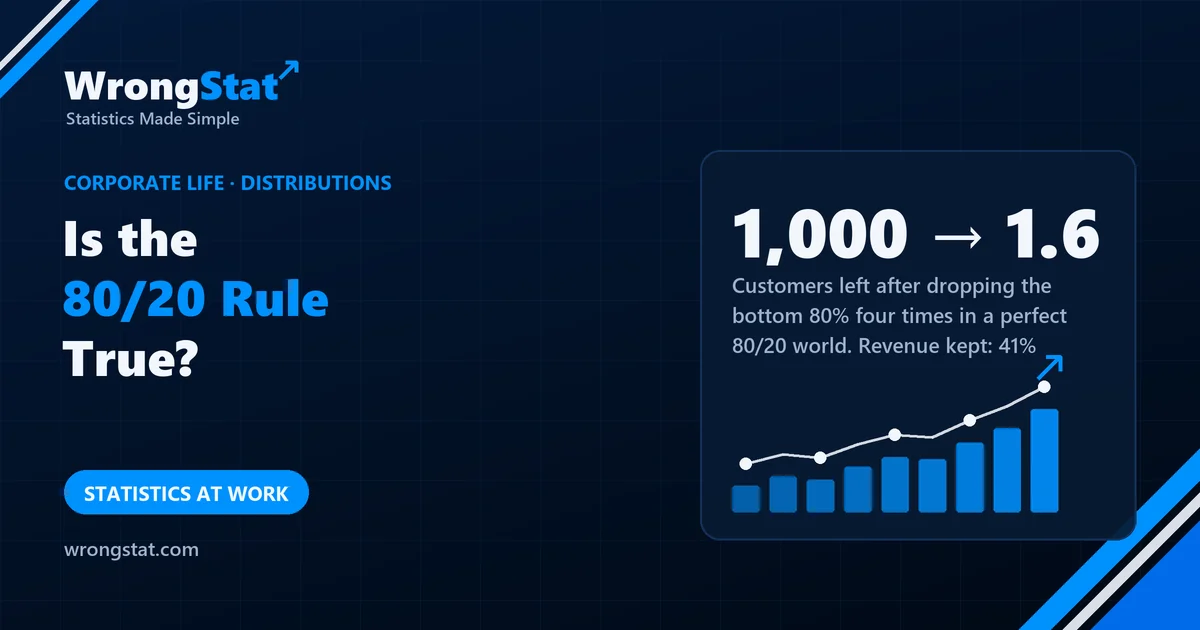
The short version: the 80/20 rule, or Pareto principle, is a rough description of lopsided distributions, not a law. How lopsided depends on the situation: if all customers were identical apart from luck, the top 20% would bring about 29% of orders; the famous 80% needs a very uneven spread. And the two numbers don't need to add up to 100. In a perfect 80/20 world, the rule also repeats inside every group, so dropping the bottom 80% of customers leaves a group that splits 80/20 again. Four rounds of that, and 1,000 customers become 1.6, with 41% of the revenue.
Kevin's boss has read a book on a plane. It says that 80% of results come from 20% of efforts. He checked: 20% of the company's customers bring in about 80% of revenue. The other 80% bring 20% and phone the help desk a lot.
The plan is to drop them and concentrate on the customers who matter. It is a good plan. Every step of what follows is a good plan.
What the rule actually says
The Pareto principle is named after an Italian economist who noticed in the 1890s that land and income were very unevenly spread: a small share of people held most of it. Decades later the pattern got its catchy numbers, 80/20, and became a rule for everything from sales to bug reports.
Two things to know about it. First, it isn't a law; it's a description of how lopsided something is, and the real split could be 60/20 or 90/10. Second, the numbers don't have to add up to 100. "20% of customers bring 80% of revenue" and "10% of customers bring 60%" can both be true of the same company.
How lopsided is lopsided?
The split depends on how different the customers really are. Here's what the top 20% bring in four example worlds:
| Example world | Top 20% of customers bring |
|---|---|
| All customers identical, only luck differs (about 10 orders each) | 29% |
| Mildly uneven | 45% |
| Quite uneven | 58% |
| Very uneven: the famous case | 80% |
Luck alone gives some lopsidedness, but nothing like 80/20. When you do see 80/20, the customers really are very different from each other. Real data can be that extreme: in a study of 53,035 salespeople, a seller at the 75th percentile brought in about 12 times as much as one at the 25th, which the researchers noted fits the 80/20 rule of thumb.
The loop
Here's the part the book on the plane left out. In a perfect 80/20 world, the rule doesn't only apply to the whole customer list. It applies inside every slice of it. Take the top 20% of customers: within that group, 20% bring 80% of the group's revenue. So Kevin's boss, having dropped the bottom 80%, looks at the new list and finds that, once again, 80% of his customers bring only 20% of the revenue.
| Round | Customers left | Revenue left |
|---|---|---|
| Start | 1,000 | 100% |
| Drop the bottom 80% | 200 | 80% |
| Again | 40 | 64% |
| Again | 8 | 51% |
| Again | 1.6 | 41% |
Each step is justified by the same rule, applied correctly to the latest numbers. After four rounds the company has one and a bit customers and less than half its revenue. The rule never says when to stop, because it isn't a rule about what to do. It's a description of what is.
Revenue kept after dropping the bottom 80% of customers, again and again
Statistics for noobs: skewed distributions
When a few values are huge and most are small, the distribution is skewed, and the average stops describing anyone: one big customer pulls the average far above what a typical customer buys. For skewed data, look at the median and at what share the top group holds, and remember that the bottom group still adds up to something. 20% of revenue is still 20% of revenue.
Where it costs you money
Investment returns are lopsided too: a small share of stocks and of trading days accounts for a large part of long-run gains. The 80/20 instinct says to concentrate on the winners. The trouble is that you only know which ones they were afterwards, and cutting the "unimportant" 80% in advance tends to cut some of the few that mattered.
The moral
Kevin's boss stopped after the second round, at 40 customers and 64% of revenue, because the help desk had gone very quiet and so had the sales floor. He has now read a second book, which says that 20% of staff do 80% of the work. Kevin has calculated where he sits in the distribution and has started phoning the help desk more often, to look busy.
What this model can't tell you
- The worlds are examples. The table comes from our own models (random orders for identical customers, and Pareto-shaped spreads for the rest), not from any company's data.
- Real data aren't perfectly self-similar. In many real distributions the pattern weakens inside the top group; in a common alternative model with an exact 80/20 split, the top 4% bring 47% rather than 64%. The loop still runs, just more slowly.
- Revenue isn't profit. Small customers may be cheap to serve or grow into big ones; big customers may demand big discounts. Decide with costs, not with shares.
Kevin's boss, the book and the customers are an illustration. The figures are from our own model: the identical-customer case is a simulation of one million customers with random orders averaging 10; the other rows and the loop use a Pareto distribution, in which the top 20% hold 80% when its shape parameter is about 1.16. The salespeople figure comes from a published study (National Bureau of Economic Research working paper, 2018). Educational content, not business or financial advice.