Does Performance Pay Work? The Windscreen Company That Paid by the Job
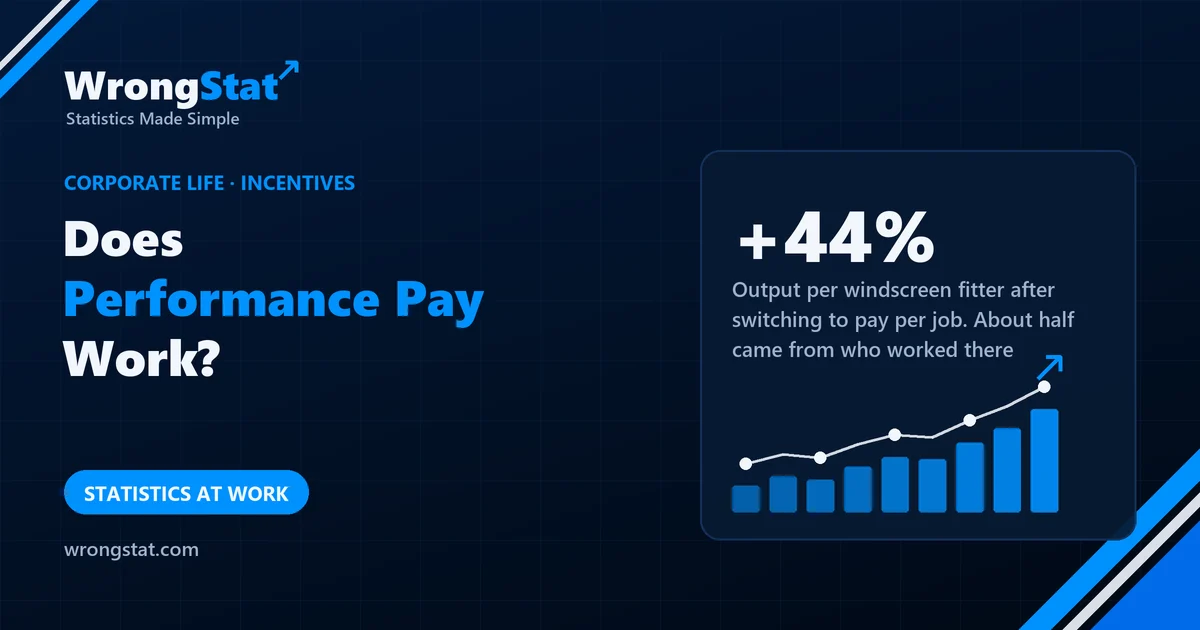
The short version: in the best-known study, yes, and by a lot. When Safelite, the largest US car-glass installer, moved its fitters from hourly wages to pay per windscreen in the mid-1990s, output per worker rose about 44%. Roughly half of the rise came from the same people working faster. The other half came from who was there: faster fitters were more likely to join and stay, slower ones to leave. A before-and-after average mixes both, and the second half doesn't copy itself into a company where nobody can leave or join.
Kevin's boss has read about pay for performance. The plan: support staff will be paid per ticket closed. Output will rise, as it did at a famous windscreen company. He has the number on a slide: 44%.
Kevin asks where the 44% came from. The boss says from paying people for results. Kevin asks whether it came from the people, or from different people. The boss says that's the same thing. It turns out it isn't.
The windscreen study
In 1994-1995, Safelite Glass, the biggest car-glass installer in the US, changed how it paid the people who fit windscreens. Instead of an hourly wage, they got a rate per windscreen installed, with a guaranteed minimum so a slow week couldn't push pay below the old level. The company's own records counted every job, so an economist could compare output per worker before and after.
Output per worker rose about 44%. That's one of the largest effects of a pay change ever measured in a real company.
Two ways the average went up
Because the data followed individual workers, the 44% could be split in two:
- The same people worked faster. Fitters who were there before and after the change installed more windscreens per day. This was roughly half of the gain.
- Different people were there. Pay per job attracts fast fitters and is less attractive to slow ones. New hires were more productive, and the best workers became less likely to quit. This was the other half.
The second half is a composition effect: the average rose partly because the group changed. Both halves are real gains for the company. They just work in different ways, and only one of them is about effort.
Why the split matters
If Kevin's company switches to pay per ticket, the effort half might carry over, if tickets are a fair measure of work. The sorting half needs people to be able to join and leave. In a team where nobody is hired or quits for a year, the sorting effect is zero, and the 44% becomes, at best, about half of that.
The split also says something about anyone who chooses to be paid by results: they're not a random sample. Comparing people on bonus schemes with people on fixed pay mostly measures who picks which, which is self-selection bias.
Statistics for noobs: did the people change, or did the group?
When an average improves after a change, ask whether you're looking at the same people. Follow the ones who were there before and after, and you see the effect on behaviour. Look at everyone at each date, and you see behaviour plus the change in who's there. Both are useful numbers, but they answer different questions.
Where it costs you money
"Funds that charge performance fees do better" has the same two halves: managers might work harder, or skilled managers might choose that fee structure. Only the first would make a fee change improve an existing fund.
The moral
Kevin's company introduced pay per ticket. Tickets closed per person rose 30% in the first month. Most of the new tickets were opened by the support team itself, then closed, which the new system counted as work. Kevin points out that a windscreen is harder to invent. The boss has asked for a 44% target next quarter.
What this study can't tell you
- A job that's easy to count. A fitted windscreen is clear and visible, and a badly fitted one comes back. Jobs with fuzzy or gameable outputs may react very differently.
- One company, one period. The study followed a single firm in the mid-1990s; it isn't an experiment with a control group.
- The split is approximate. "About half" comes from the study's own breakdown; the exact share depends on how the analysis is done.
Kevin, his boss and the ticket scheme are an illustration. The figures come from the published study of Safelite's switch to piece rates (American Economic Review, 2000). Educational content, not business, career or financial advice.