Myth #4 · Volume
Does Volume Confirm the Trend? Sometimes It Contradicts It.
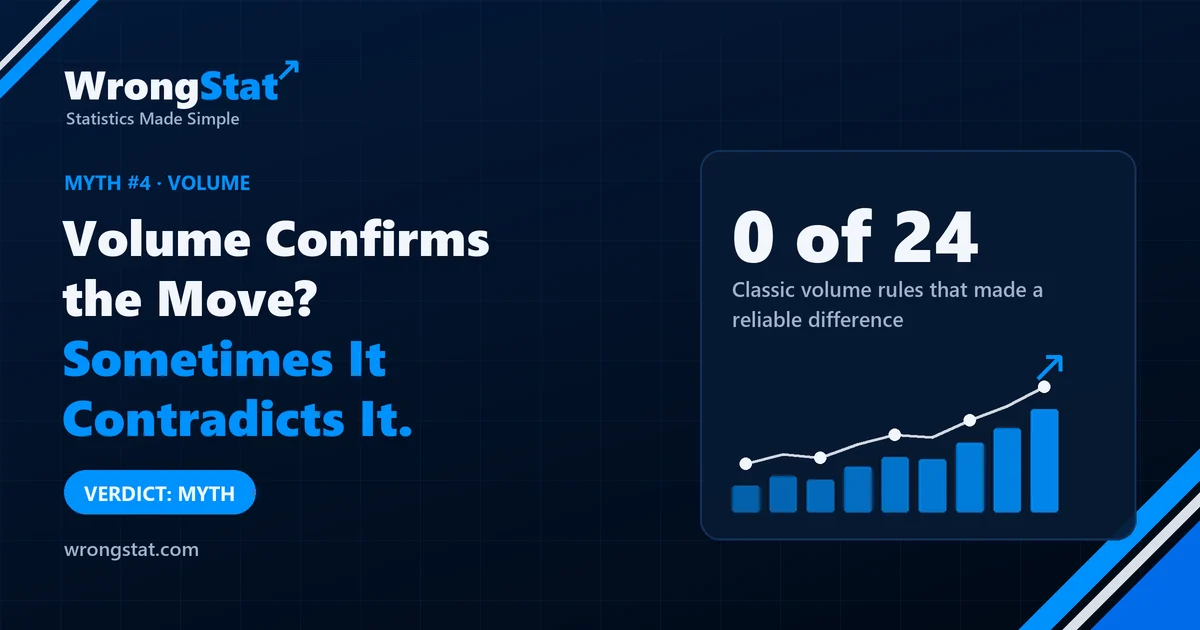
Verdict: myth. We tested three classic volume rules from the trading books: breakouts on heavy volume, the "selling climax" bottom, and new highs on weak volume. None made a reliable difference. The selling climax even pointed the wrong way.
Uncle Gary has a new rule, copied from a trading forum: "Volume precedes price." He says it slowly, like a fortune cookie.
Aunt Linda has used the same rule for years, but for parties. If the party is loud, it's a good party. If it's quiet, everyone is about to leave. She has been wrong about at least three christenings.
Trading books say the same thing about stocks: a move on loud trading is real, a move on quiet trading is fake. We turned up the volume and checked.
What we tested
- About 490 US stocks, daily data from 2010 to 2026.
- Loud or quiet: a day's volume compared with the stock's average over the previous 20 days. 1.5 times normal is loud, 2.5 times is very loud.
- Rule 1, the breakout: the price hits a new 20 or 60-day high. Is it better on loud volume (at least 1.5 times normal) than on quiet volume (below normal)?
- Rule 2, the selling climax: the price falls 8% or 12% in five days. Does a very loud fall (2.5 times normal volume) mark the bottom better than a quiet one?
- Rule 3, the weak new high: the price makes a new high, but on lower volume than the previous high. Does that warn of a fall?
- The trade: in at the next day's open, out after 5, 20 or 60 trading days. Costs: 0.05% per round trip for buying, 0.30% for shorting.
- The fair comparison: each result is measured against the average of all stocks over the same days, so a rising market doesn't get the credit. And we only compared loud with quiet versions of the same event, at the same level of volatility, so jumpy stocks couldn't skew it.
That's 24 versions in total, each with thousands to hundreds of thousands of events.
What we found
Rule 1: loud breakouts weren't better. Breakouts on heavy volume did between -0.01 and +0.22 percentage points better than quiet ones. None of it was significant, and it flipped around: roughly zero or negative in the first half of the data, positive in the second. With 36,000 to 52,000 loud breakouts and over 100,000 quiet ones, the problem wasn't too little data.
Rule 2: the selling climax did the opposite. The theory says a big, noisy sell-off means everyone who wanted out is out, so the bottom is in. In our data, stocks that fell on very heavy volume did 0.25 to 3.94 points worse afterwards than stocks that fell quietly. Not quite significant, but the wrong way every time. Heavy selling looked less like the end of the bad news and more like the start of it.
Rule 3: weak new highs predicted nothing. New highs on fading volume did between -0.54 and +0.17 points different from new highs on rising volume, and the sign kept changing depending on the holding period and which half of the data we looked at.
| Rule | What the books say | Loud vs quiet, per trade | Verdict |
|---|---|---|---|
| Breakout on heavy volume | More reliable | -0.01 to +0.22 pp | No difference |
| Selling climax | Marks the bottom | -0.25 to -3.94 pp | Wrong way |
| New high on weak volume | Warns of a fall | -0.54 to +0.17 pp | No difference |
Across all 24 versions, not one showed a significant difference that also held up in both halves of the data. The correlation between volume and what happened next was close to zero everywhere.
Loud vs quiet volume, per trade (percentage points)
Statistics for noobs: big numbers aren't proof
"Loud breakouts did up to 0.22 points better" sounds like something. But a difference that is positive in one half of the data and negative in the other is a coin landing heads for a while and then tails for a while.
A real effect should show up whichever slice of time you look at. This is why we always split the data in two and check both halves. Most "findings" don't survive the split.
The moral
Volume tells you how many people traded. It doesn't tell you whether they were right. In our data, it added nothing to what the price was already saying. Interestingly, the trading text we tested this from admitted as much: volume is "good to have, not a must". In our test, it wasn't even that.
Aunt Linda still judges parties by the noise. Uncle Gary still says "volume precedes price". Both are louder than they are right.
What this test can't tell you
- Daily data only. Volume within the day, like the first minutes after a breakout, was not tested.
- Our definitions. We had to pick exact thresholds for "loud" and "quiet". Other thresholds might give other numbers, though none of ours came close.
- Survivorship bias. We used stocks listed today, so companies that collapsed after a selling climax are missing. If anything, that makes the climax look better than it was.
Simulation on historical data, not real trades. About 490 US stocks listed today with at least 800 trading days of history, 2010-2026. Results measured against the average of all stocks over the same days, after costs. 24 variants tested; results corrected for multiple testing. Historical results do not guarantee future returns. This is educational content, not financial advice.