Myth #15 · Calendar effects
Do Bonds Go Up at the End of the Month? The Turn-of-the-Month Effect, Tested.
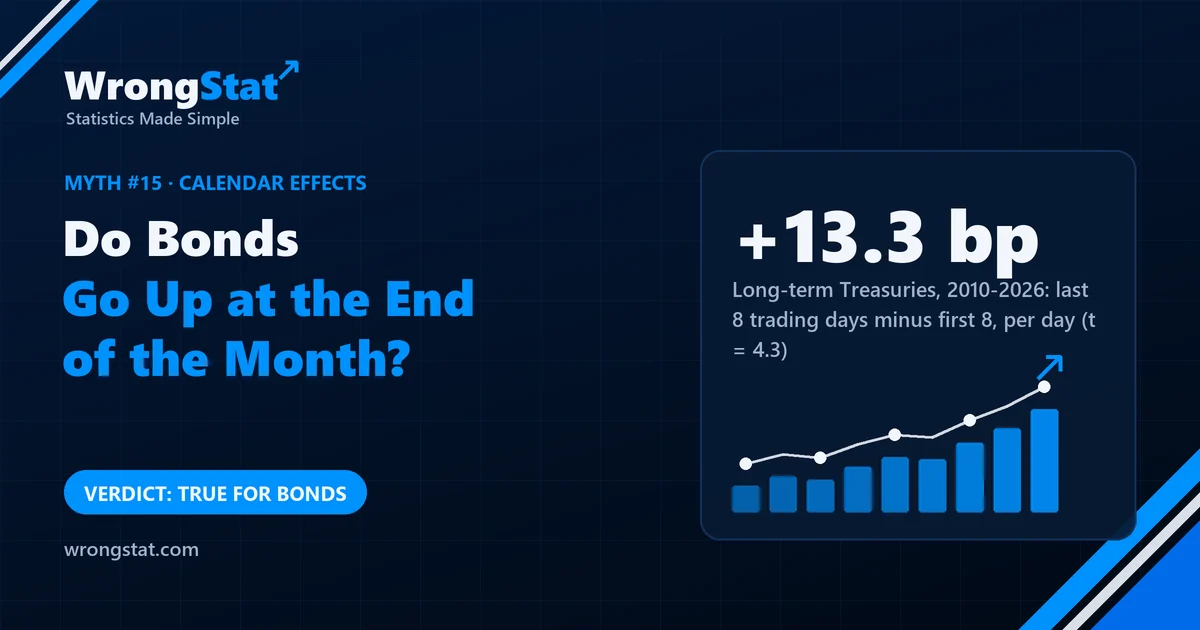
Verdict: true, for government bonds. In 201 months from 2010 to 2026, long-term US Treasury bonds gained in the last 8 trading days of the month and lost in the first 8, a gap of 13.3 basis points a day (t = 4.3), positive in both halves of the data and in 13 of 17 years. It showed up in every Treasury and investment-grade bond fund we checked back to 2003, grew with bond maturity, and was absent from stocks. A real pattern can still shrink once it's widely traded, and none of this is a recommendation.
Cousin Kevin has found a new calendar trick: "Long-term government bonds go up in the last week of every month and down in the first week. Something to do with funds rebalancing." He wants to know if it's real before he tells Uncle Gary, who already believes in eleven calendar tricks.
We've tested a lot of calendar tricks. We expected to write another myth. We were wrong, and we're publishing that too.
What we tested
- The bonds: a fund holding long-term US Treasury bonds (20 years and more), daily from January 2010 to September 2026: 201 months.
- The comparison: the average daily return in the last 8 trading days of each month against the first 8 trading days, tested month by month.
- Robustness: windows from 3 to 12 days instead of 8; the data split before and after 2020; every year separately; a placebo that moved the "start of the month" to random days 500 times.
- Other markets: the S&P 500 over the same period, then eleven bond funds of different kinds, plus stocks, gold, high-yield and municipal bonds, back to 2003.
The result
| Long-term Treasuries, 2010-2026 | Average per day |
|---|---|
| Last 8 trading days of the month | +7.5 basis points (p = 0.001) |
| Middle of the month | +2.3 basis points |
| First 8 trading days | -5.7 basis points (p = 0.02) |
| Gap, last 8 minus first 8 | +13.3 basis points (t = 4.3) |
A basis point is a hundredth of a per cent, so 13.3 a day sounds tiny. Over 8 days at each end of the month, it adds up to a clear pattern. More important than the size is how stubborn it was:
- Both halves: +14.9 basis points a day before 2020 and +10.9 from 2020 (p = 0.036).
- Most months and years: positive in 65% of months and in 13 of 17 years.
- Any window: 3 days gave 18.1, 5 days 14.9, 8 days 13.3, 10 days 9.4, 12 days 8.2. The effect fades smoothly as the window widens, which is what a real end-of-month effect looks like, rather than one lucky choice of window.
- The placebo: with the month's start moved to random days, the gap averaged -2.1 basis points, and none of 500 tries came close to 13.3.
- Stocks: the S&P 500 showed no such gap (-4.0 basis points a day, not significant).
The check that convinced us
If the cause is month-end rebalancing of bond indices, the effect should appear in other government and high-quality bond funds, be bigger in longer bonds (whose prices move more), and be missing elsewhere. Going back to 2003:
| Fund type, 2003-2026 | Gap per day, last 8 minus first 8 |
|---|---|
| Short-term Treasuries (1 to 3 years) | +1.0 basis point |
| Treasuries 3 to 7 years | +2.7 |
| Treasuries 7 to 10 years | +4.2 |
| Long-term Treasuries (20+ years) | +11.2 |
| Very long-term Treasuries | +17.7 |
| Whole US bond market | +3.7 to +4.1 |
| High-yield bonds, municipal bonds, stocks, gold | +2.4, +1.5, -1.8, -3.2 (none significant) |
All eleven Treasury and broad bond funds showed it (each with p below 0.001, though they're closely related, so that's less than eleven independent confirmations). The effect grew step by step with maturity and was absent where the rebalancing story says it should be absent. That's the shape of a real mechanism, not a fluke.
As a simple trade, holding long-term Treasuries only in the last 8 days of each month earned about 0.55% a month after costs while invested about 40% of the time, against 0.24% a month for holding them all the time, from 2010 to 2026. That's a description of the past, not a plan for anyone's money.
End-of-month gap in bond funds: last 8 trading days minus first 8, per day
Statistics for noobs: what a real effect looks like
Most "effects" we test are one good number. This one passed the checks that usually kill them: it held in data before and after the split, it didn't depend on one choice of window, it beat a placebo, it showed up in related assets in the order a mechanism predicts, and it didn't show up where the mechanism says it shouldn't. A single p-value is weak evidence. A pattern of consistent checks is strong evidence.
The moral
Kevin was right, which happens, and we're as surprised as anyone. Gary has added it to his list as calendar trick number twelve, between "sell in May" and "never buy on a full moon". We've asked him not to treat one survivor as evidence for the other eleven, which we haven't tested, and which he believes anyway.
Every test on this site is judged against simple alternatives. This one beat its alternative, holding the same bonds all the time, and the placebo, and still has to face the future.
What this test can't tell you
- Whether it continues. Patterns that are known can be traded away. It was a bit weaker after 2020 than before.
- Real trading costs. We used 0.05% per round trip. Betting on the fall at the start of the month would cost much more.
- One era of bond markets, mostly falling and then rising interest rates and large central bank buying.
- Not stocks. Nothing here says anything about the stock market at the turn of the month; our test found nothing there.
Statistical tests and simulations on historical data, not real trades. Daily prices of US bond funds, an S&P 500 index fund and other funds, 2003 to 2026, with 0.05% costs per round trip in the trading example. Historical results do not guarantee future returns. This is educational content, not financial advice.