Why You Shouldn't Check an A/B Test Every Day
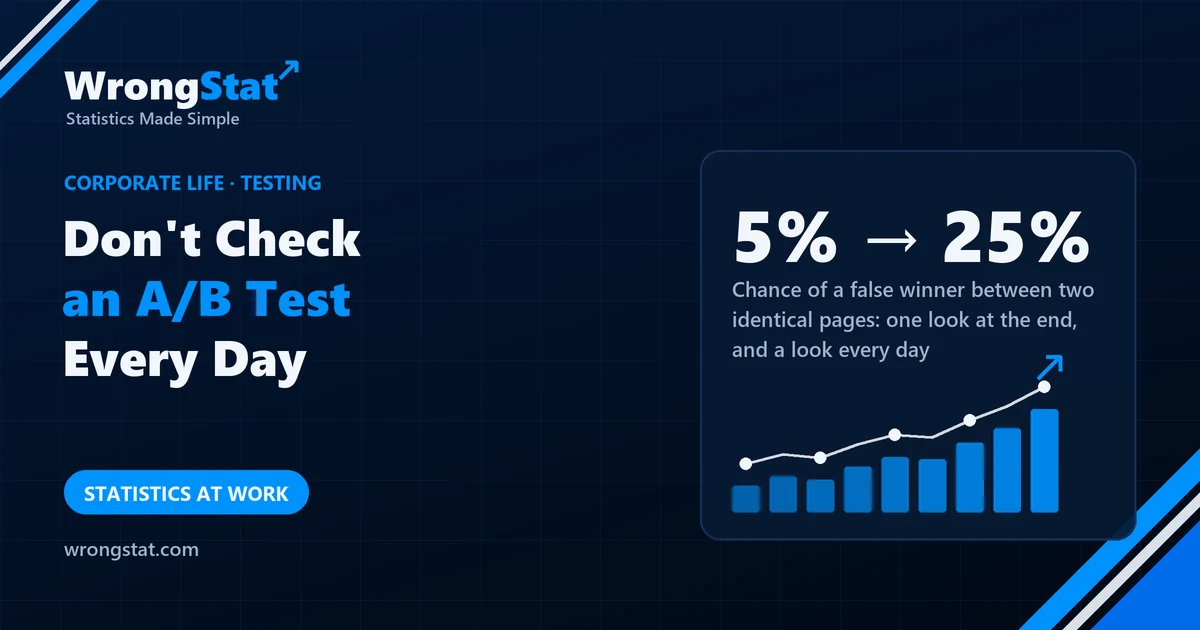
The short version: a significance test promises a 5% chance of a false alarm if you look once, at the end. Look every day and stop at the first 'significant' result, and the chance goes up a lot. In our simulation of two identical web pages with 1,000 visitors a day each, checking once after 20 days gave a false winner 5% of the time, checking weekly 13%, checking daily 25%, and checking daily for 60 days 34%. More than half the false winners appeared in the first five days. The fix: decide the sample size in advance, or use a method built for repeated looks.
Marketing is testing a new green "Buy" button against the old blue one. Half the visitors see each. The plan is to check the dashboard every morning and roll out the winner as soon as the result is statistically significant.
On day 4, green is ahead with p = 0.03. The team rolls it out, announces a 9% lift in conversions, and orders cupcakes with green icing.
Kevin asks what happens if you run the same test with two blue buttons. Nobody has ever tried.
What a significance test promises
A standard test asks: if the two versions were really the same, how surprising would this difference be? If it would happen less than 5% of the time by chance (the p-value is below 0.05), the result is called significant. So with two identical versions, you'll still get a false "winner" in about 1 test in 20.
The small print: that 5% applies if you look once, at a point you chose in advance. The test doesn't know how many times you peeked.
What peeking does
We simulated 200,000 tests of two identical pages: both convert 5% of visitors, each gets 1,000 visitors a day, and the team stops as soon as the difference is significant.
| How often you check | Chance of declaring a false winner |
|---|---|
| Once, after 20 days | 5% |
| Every week, for 4 weeks | 13% |
| Every day, for 20 days | 25% |
| Every day, for 60 days | 34% |
The two buttons are identical in every run. Each daily look is another chance for random noise to cross the line, and you only need it to cross once. With enough looks, the chance keeps rising.
Chance of declaring a false winner between two identical pages
Why false winners come early
In the first few days there are few visitors, so the numbers jump about a lot, and big, exciting differences are easy to get by chance. Of the false winners in our daily-checking runs, 57% appeared in the first five days. And 20% of all tests were "significant" on some day but not at the end, which means that if the team had waited, the winner would have disappeared on its own.
This is why early results look so impressive: the "9% lift" on day 4 is large because it's early, not in spite of it. Stopping a test when it looks good is a reliable way of choosing results that look better than they are.
Statistics for noobs: optional stopping
Deciding when to stop based on the results so far is called optional stopping. It's the same problem as testing many things at once and reporting the one that worked, spread out over time.
Three honest options: decide the sample size before you start and look only then; if you must look along the way, use a method designed for it, which sets a stricter threshold at each look; or run the winner again on fresh traffic before celebrating.
Where it costs you money
Checking a new trading strategy every day and going all in the first week it's well ahead is peeking. So is stopping a backtest at the date where it looks best. Fix the test period first, then look.
The moral
Kevin ran the test with two blue buttons. On day 3, the second blue button was ahead with p = 0.04. Marketing has asked to roll it out. Kevin has pointed out that it is the same button. Marketing says the data are the data, and the cupcakes have been ordered in blue.
What this simulation can't tell you
- A model of one setup. The exact rates depend on traffic, conversion rate and how often you look; the direction doesn't.
- Real differences are different. When one version really is better, peeking can still help you stop early. The problem is that it also stops on noise, and you can't tell which from one test.
- Some tools adjust for peeking. Many testing platforms now offer methods built for continuous monitoring; check which one yours uses before trusting its "significant".
Marketing, the buttons and the cupcakes are an illustration. The figures come from our own simulation of 200,000 tests (100,000 for the 60-day row) with two identical versions converting 5% of 1,000 daily visitors each, using a standard two-proportion test at the 5% level. Educational content, not financial advice.