Myth #22 · Currencies
Does the Dollar Predict the Stock Market? We Tested 30 Currency Pairs.
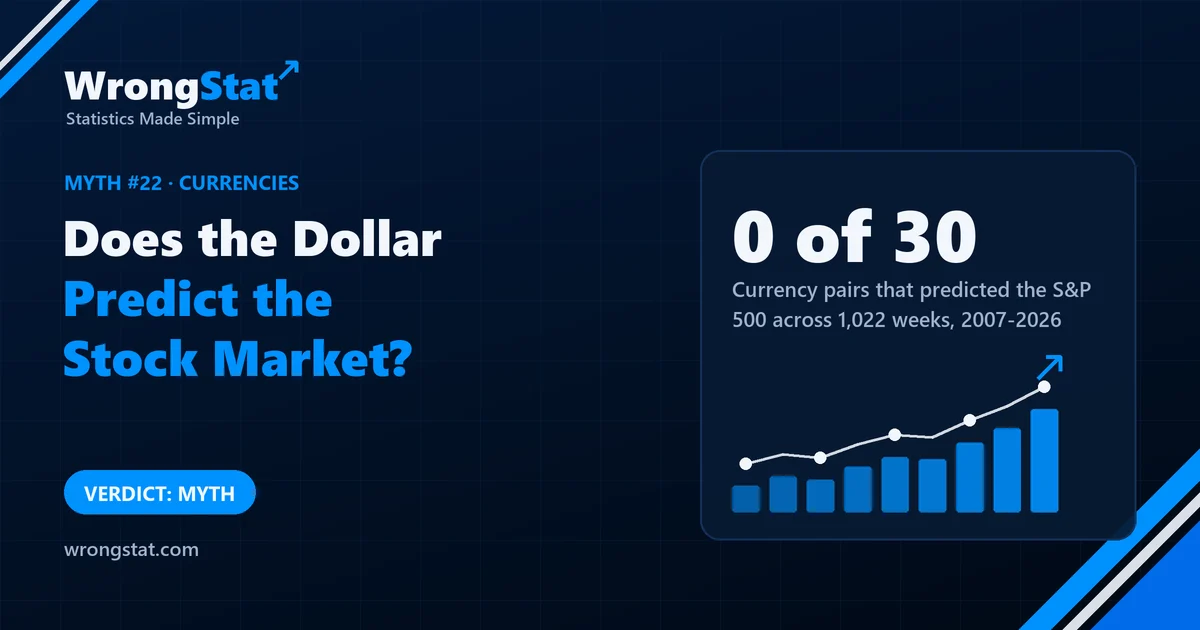
Verdict: myth. Over 1,022 weeks from 2007 to 2026, none of 30 currency pairings predicted the S&P 500 over the following week across the whole period; two were significant in the later years, about what chance alone produces, and the early winners flipped. The post's euro-dollar rule grew 7.5% a year since 2016 against 14.9% for simply holding. Its smaller losses came from being out of the market half the time, not from knowing when. We found no signal; that's not proof that currencies never matter for stocks.
Uncle Gary has found a post that connects everything. "When the euro is beating the dollar, money is flowing into risk," he reads aloud. "Stay in stocks. When the dollar wins, get out." The post had a chart going back years, rising beautifully.
Aunt Linda asks how the post's author chose the euro and the dollar, out of all the currencies in the world. Gary says it's obvious. We tested the obvious one and all the others.
What we tested
- Six major currencies: the US dollar, the Japanese yen, the euro, the Swiss franc, the Australian dollar and the British pound, through funds that track them.
- Every pairing: for each ordered pair (A against B), the rule is "if A has beaten B over the last 4 weeks, hold the S&P 500 next week, otherwise stay out". Six currencies make 30 ordered pairs.
- The data: 1,022 weeks from 2007 to 2026, split before and after 2016.
- The question: did the S&P 500 do better in the weeks the rule was in than in the weeks it was out?
The result
| 30 currency pairs | 2007-2015 | 2016-2026 | Whole period |
|---|---|---|---|
| Significant pairs (p below 0.05) | 0 | 2 | 0 |
| Expected by chance alone | about 1.5 | ||
| Average gap, weeks in minus weeks out | -1.0 bp | 0.0 bp | -0.4 bp |
Half the pairs (15 of 30) had a positive gap, exactly like tossing a coin. And the pairs that looked best in the early years turned around: "pound beats euro" went from -44.8 basis points a week to +12.8, and its mirror image "euro beats pound" from +43.0 to -12.8. A pattern that reverses as soon as you stop looking at the data you found it in isn't a pattern.
The post's own rule
| "Hold when the euro beat the dollar" | 2007-2015 | 2016-2026 |
|---|---|---|
| Gap per week, in vs out | +28.1 bp (p = 0.27) | +4.4 bp (p = 0.82) |
| Rule: growth per year | 7.4% | 7.5% |
| Holding the S&P 500: growth per year | 6.7% | 14.9% |
| Rule: worst fall | 18% | 23% |
| Holding: worst fall | 54.6% | 31.8% |
| Return per unit of risk (Sharpe), rule vs holding | 0.64 vs 0.43 | 0.78 vs 0.91 |
In the early years, which include the 2008 crash, the rule looked impressive: a worst fall of 18% against 54.6%. But it was out of the market about half of the time, and a rule that sits out half the time can easily miss a big part of a crash without knowing anything. A very similar rule using the Swiss franc did the same before 2016 (+21.5 basis points a week, p = 0.41) and then nothing (+1.0, p = 0.96). Since 2016 the euro rule grew at half the speed of simply holding and earned less per unit of risk. The beautiful chart in the post was the years it was chosen from.
Statistics for noobs: picking the best of 30
If you test 30 versions of an idea, about 1 or 2 will look significant by chance at the usual 5% threshold. Choosing the best of them and showing only that one is multiple testing in its purest form. The cure is to check the chosen version on years you didn't use to choose it, an out-of-sample test. Here, the winners of the first period lost in the second.
The moral
Gary's post wasn't wrong about its own chart. It was wrong about the future, which is the only part that would have paid. Linda points out that if the euro knew where the S&P 500 was going, the people who trade the euro all day would have noticed by now. Gary says they're probably keeping it quiet.
Every test on this site is judged against simply holding the market. This rule held half the market and earned half the growth.
What this test can't tell you
- One kind of rule. We tested 4-week currency moves and the next week of stocks. Other horizons or combinations weren't tested.
- Before costs. Switching in and out every week would cost something; it would only make the rules look worse.
- Six currencies. Emerging-market currencies weren't included.
- Absence of evidence. "No signal in our test" isn't proof that currencies never carry information about stocks.
Statistical tests and simulations on historical data, not real trades. Weekly prices of six currency funds and the S&P 500, 2007 to 2026, before trading costs. Historical results do not guarantee future returns. This is educational content, not financial advice.