Myth #20 · Gaps
Should You Buy a Stock That Gaps Down? We Tested Buying the Opening Drop.
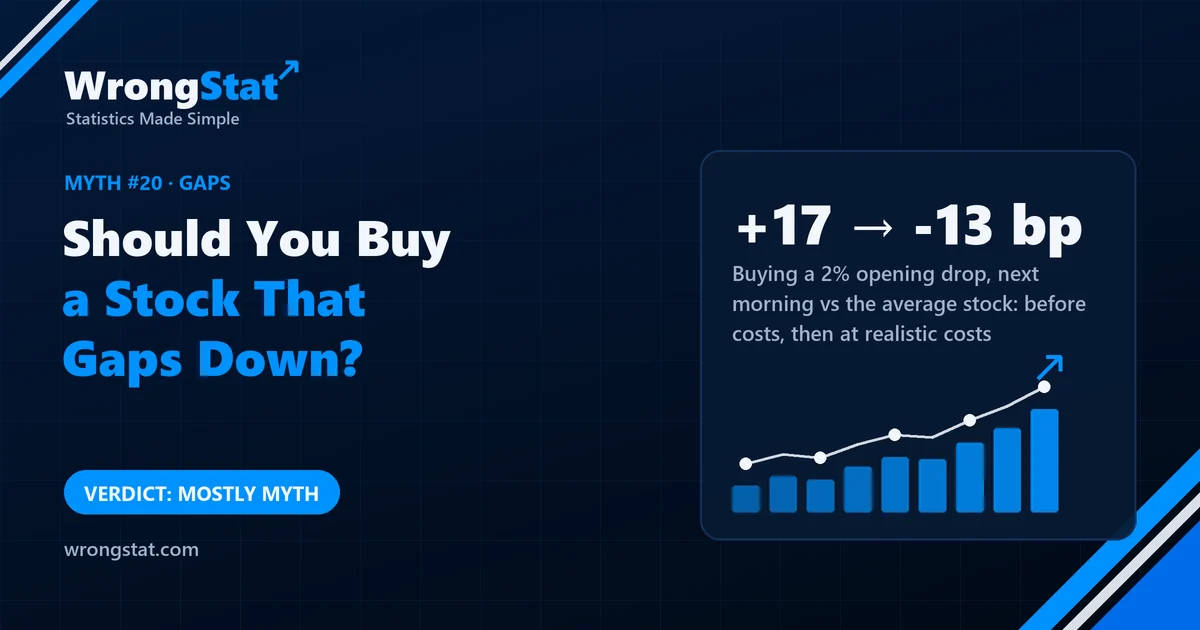
Verdict: mostly myth. On 581 US stocks from 2010 to 2026, buying a stock that opened 2% or more lower and selling at the next open beat the average stock by 17.2 basis points before costs, in both halves of the data. But the bounce was concentrated on mornings when the whole market panicked, which makes it a bet on the market rather than on the stock, and at realistic costs for trading at the open it became a loss of 12.8 basis points. We found no edge you could keep after costs; that's not proof that none exists.
Uncle Gary has a morning routine. He scans for stocks in an uptrend that open at least 2% below yesterday's close, buys them at the open, and sells the next morning. "Panic is an overreaction," he explains, buttering his toast. "I'm just the adult in the room."
Aunt Linda asks who the adult in the room pays to get in and out at 9:30. Gary says that's a detail. We made it a column.
What we tested
- The signal: a stock opens at least 1%, 2% or 3% below its previous close, while trading above its 200-day average (an uptrend).
- The trade: buy at that open, sell at the next day's open.
- The comparison: the average of all 581 stocks over the same night. That removes the market's own move, so we measure what's special about the gapping stock.
- Costs: 0.1% per round trip as standard, and a more realistic 0.3%, because spreads are wide at the open after a gap.
- The data: 581 US stocks, daily prices from 2010 to 2026, split before and after 2020.
The headline result
| Opened lower by | Next morning, over the average stock | After 0.1% costs |
|---|---|---|
| 1% or more | +7.0 bp (p = 0.03) | -3.0 bp |
| 2% or more | +17.2 bp (p = 0.003) | +7.2 bp |
| 3% or more | +21.2 bp (p = 0.011) | +11.2 bp |
A basis point (bp) is a hundredth of a per cent. So far Gary looks good: the bigger the drop, the bigger the bounce, and the 2% version held up in both halves of the data (+15.5 before 2020, +19.9 from 2020). The uptrend filter, though, made no difference: without it, the bounce after a 2% gap was 20.6 basis points, about the same.
Where the bounce really comes from
We split the 2% gaps by what the rest of the market was doing that morning:
| Kind of morning | Days | Next morning, over the average stock |
|---|---|---|
| Whole market opened sharply lower (panic) | 265 | +40.5 bp (t = 3.8) |
| Market calm, only this stock dropped | 2,195 | +13.3 bp (p about 0.07) |
The strong bounce happened on panic mornings, when everything gapped down and then the market recovered a little. That's not Gary picking good stocks; it's Gary buying the market on its worst mornings. On ordinary days, when one stock dropped on its own news, the bounce was smaller and not clearly different from chance, and after 0.1% costs it was 3.3 basis points.
And costs at the open after a gap are rarely 0.1%. With a more realistic 0.3% round trip, the whole strategy came out at -12.8 basis points per trade. The years also swung wildly, from +101 basis points in 2016 to -170 in 2025, because a few panic days dominate each year.
Buying a 2% opening drop: next morning vs the average stock
Statistics for noobs: separate the market from the stock
When a signal fires mostly on days when everything moves together, a good result may be a bet on the whole market dressed up as stock-picking. Split the results by what the market did. If the edge lives only on market-wide days, you've found a timing idea, with its own risks, not a way of choosing stocks.
And price the trading costs you'd really pay at that moment. A 0.1% assumption and a 0.3% reality turned a profit into a loss.
The moral
Gary is right that panic overshoots. He's just not the only adult in the room: the people quoting him prices at 9:30 on a gap-down morning have noticed too, and they charge for it. Linda has suggested he keep the routine and skip the trade. He has kept the toast.
Every test on this site is judged against the average stock and after costs. This one passed the first test and failed the second.
What this test can't tell you
- Daily opening prices. Real fills at the open can be worse than the official opening price, which would make things worse still.
- One holding period. We sold at the next open; other exits weren't tested.
- US stocks listed today, which brings survivorship bias: stocks that gapped down and kept falling until they disappeared are missing.
- Absence of evidence. "No edge after realistic costs in our test" isn't proof that no gap strategy can work.
Statistical tests and simulations on historical data, not real trades. Daily prices of 581 US stocks listed today, 2010 to 2026, with 0.1% and 0.3% costs per round trip. Historical results do not guarantee future returns. This is educational content, not financial advice.