Myth #14 · Trend following
Does the 200-Day Moving Average Strategy Work? We Tested It on the S&P 500.
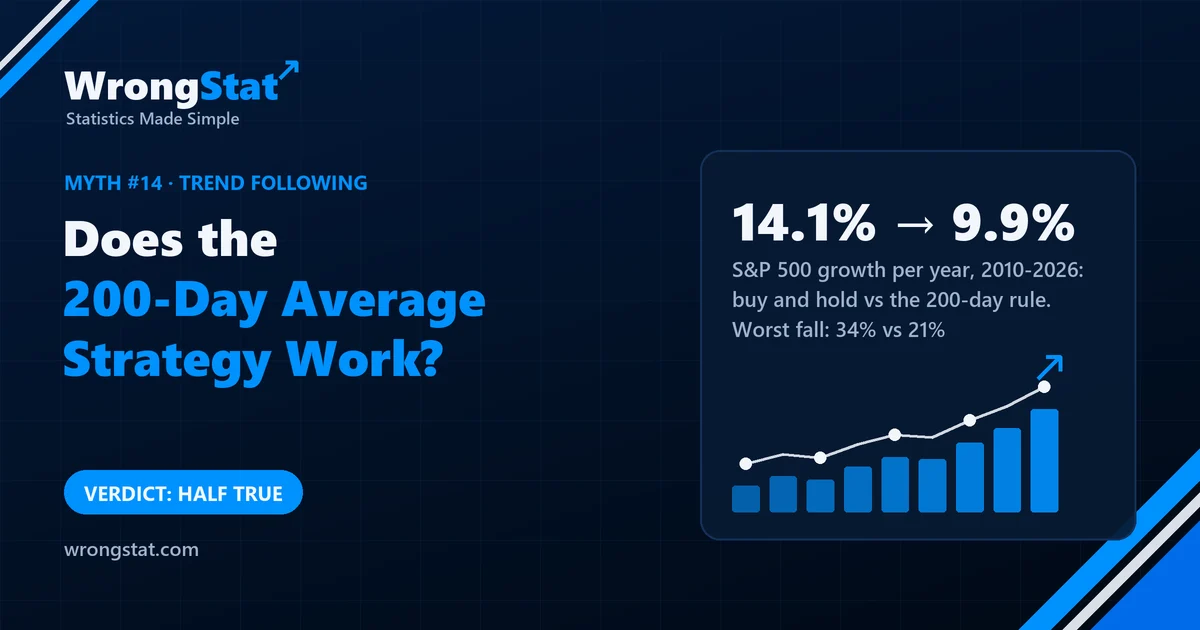
Verdict: half true. On the S&P 500 from 2010 to 2026, the 200-day rule did what it promises on the way down: the worst fall shrank from 33.7% to 20.7%. But growth fell from 14.1% a year to 9.9% after costs, and the return per unit of risk was the same as just holding. It's a seatbelt, not an engine. A 12-month rule and a 20-day rule did worse, the 12-month one worse than random timing.
Uncle Gary has a rule he's proud of: when the S&P 500 is above its 200-day average, he's in. When it drops below, he sells everything and waits. "The big crashes always start below the 200-day," he says. "I just step aside."
Aunt Linda asks how much he's made since he started stepping aside. Gary says that's not the point, the point is he sleeps well. Both of those turned out to be measurable.
What we tested
- The market: the S&P 500, through a fund that tracks it, daily from 2010 to 2026.
- Three rules: hold while the price is above its 200-day average; hold while the last 12 months' return is positive; and a fast version, hold while the price is above its 20-day average. Otherwise, cash.
- Costs: 0.05% every time the rule switches in or out.
- The comparison: simply buying the index in 2010 and holding it. We compared yearly growth, the worst fall from a peak (the drawdown) and the return per unit of risk (the Sharpe ratio).
- A luck check for the 12-month rule: the same amount of time in the market, but with the rule's timing shifted at random 1,000 times.
The result
| Strategy, 2010-2026 | Growth per year | Worst fall | Return per unit of risk |
|---|---|---|---|
| Buy and hold | 14.1% | 33.7% | 0.86 |
| 200-day rule | 9.9% | 20.7% | 0.88 |
| 12-month rule | 8.2% | 31.4% | 0.64 |
| 20-day rule | 5.0% | not reported | 0.53 |
The 200-day rule did its job on the way down: its worst fall was about a third smaller than buy and hold's. Gary does sleep better. But it paid for that every time it sold near a bottom and bought back higher, which happens a lot with a slow average. The growth gap, about 4 points a year, adds up: compounded over the 16 and a bit years, 14.1% a year multiplies the money roughly 9 times, 9.9% roughly 5 times. The return per unit of risk, 0.88 against 0.86, was the same.
The 12-month rule was in the market 84% of the time. When we kept that 84% but placed it at random, the random versions scored better on average (0.78) than the real rule (0.65), in 97% of the 1,000 tries. Its timing added nothing; if anything, it subtracted. The 20-day rule switched so often that it mostly bought noise.
S&P 500, 2010-2026: growth per year and worst fall
A seatbelt, not an engine
A trend rule like this one doesn't predict the market. It reacts to it, late, in both directions. Late out means you take part of every fall; late back in means you miss part of every recovery. In a period with sharp falls and fast recoveries, like 2010 to 2026, those two costs roughly cancel the benefit, except for one thing: the deepest hole is shallower. That's worth something to a person. It isn't a statistical edge.
Statistics for noobs: compare the risk, not just the return
A strategy that is out of the market part of the time will usually grow more slowly and fall less. Comparing only growth makes it look bad; comparing only the worst fall makes it look brilliant. The fair question is how much return it earns per unit of risk, which is what the Sharpe ratio measures. Here that number didn't move.
And when a rule spends a fixed share of time in the market, test it against random timing with the same share. Otherwise you can't tell good timing from simply being invested.
The moral
Gary is right that his rule avoids the worst of the crashes. Linda is right that it costs him. The rule turns out to be insurance, and he's been paying the premium without reading the policy. Gary says he'll keep it, because he couldn't sit through a 34% fall. That's a perfectly good reason. It just isn't the one he gave at the barbecue.
Every test on this site is judged against simple alternatives. Here the alternative was doing nothing, and doing nothing grew faster.
What this test can't tell you
- One market, one period. 2010 to 2026 had fast recoveries. Long, slow bear markets, such as 2000 to 2002 or 2008, are where trend rules are usually said to help most; they aren't in this data.
- No taxes, no interest on cash. Selling and buying back can trigger taxes that holding doesn't; interest earned while out of the market isn't counted either.
- Absence of evidence. "No better return per unit of risk in our test" isn't proof that no trend rule can ever beat holding.
Simulations on historical data, not real trades. Daily prices of an S&P 500 index fund, 2010 to 2026, with 0.05% costs per switch; taxes and interest on cash not included. Historical results do not guarantee future returns. This is educational content, not financial advice.