Why Do Projects Always Take Longer Than Planned? The Planning Fallacy in Numbers
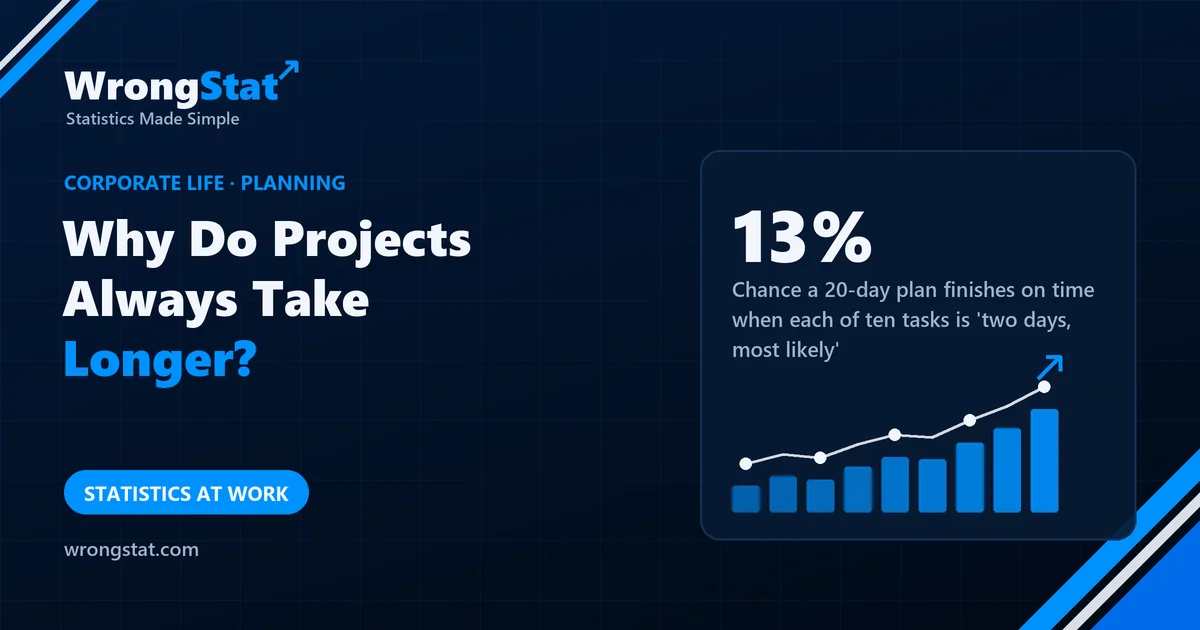
The short version: a plan built from each task's most likely duration is almost always late, even when every estimate is honest. Tasks can finish a day early but run days late, so the delays outweigh the gains. In our example ten tasks of 'two days, most likely' give a 20-day plan, an average of 26 days, and only a 13% chance of being on time. People also ignore their own track record: students who estimated their thesis at 34 days took 56, longer even than their worst-case guess. The fix is to ask how long similar projects actually took.
Cousin Kevin has been asked to plan the new client portal. He has done it properly. Ten tasks. For each one he asked himself: how long will this most likely take? Two days. Each answer was honest, each was checked with the person doing the work, and each was, individually, correct.
The plan says 20 working days. Kevin's boss has promised the client 20 working days. The client has planned a launch party for day 21. Everybody in this story is being reasonable, and that's the problem.
Why "most likely" adds up to "late"
Look at how one task really behaves. It might go smoothly and take a day. Most often it takes two. Sometimes the test server is down and it takes three. Occasionally the supplier's documentation turns out to be fiction and it takes six. In our example the odds look like this:
| One task takes | 1 day | 2 days | 3 days | 6 days |
|---|---|---|---|---|
| Chance | 20% | 45% (most likely) | 20% | 15% |
"Two days" is the most likely answer. But a task can be at most one day early and up to four days late. Averaged over many tasks, one task takes 2.6 days, not 2. That's what a lopsided, right-skewed distribution does: the most likely value sits to the left of the average, because the long tail is all on the late side.
Now add ten of them. We simulated 400,000 versions of Kevin's project:
- Average length: 26 days, not 20.
- Chance of finishing within the 20-day plan: 13%.
- To be 80% sure of finishing, you'd need to promise 30 days; for 90%, 33 days.
Nobody lied, nobody was lazy, every estimate was the most likely value. The plan was late on the day it was written. Each step is sensible and the whole is absurd, which is the most corporate sentence we know.
Chance the project is finished by day…
And we don't learn from last time
You'd think experience would fix this. In a famous 1994 study, psychologists asked 37 students when they would finish their final-year thesis. Their best estimate averaged 33.9 days. Asked for a worst case, "if everything goes as badly as it possibly can", they said 48.6 days. They actually took 55.5 days, longer than their own worst case, and only about 30% finished by the date they had predicted.
The same research found that people judged others' timelines more accurately than their own, and that when planning they thought about the steps of this project rather than how long past projects had taken. This is the planning fallacy: the plan describes how the project should go, and the past describes how projects do go, and we listen to the plan.
Statistics for noobs: the outside view
The fix has a name, reference-class forecasting, and a simple version: before you add up the tasks, ask "how long did the last five similar projects take compared with their plans?" If they ran 30% over, add 30%. It feels pessimistic. It's just accurate.
And when you add up estimates, remember that "most likely" for each part is not "most likely" for the whole. For anything that can go wrong in only one direction, the total is later than the sum of the typical parts.
Where it costs you money
Home renovations, savings goals and retirement plans all suffer from the same arithmetic. A savings plan that assumes the most likely year every year has no room for the bad year, and costs pile up on one side. Build the plan from what usually happens to plans like yours, then add a buffer for the tail.
The moral
Kevin presented the simulation and suggested promising the client 30 days. His boss said that 30 days sounded unambitious and asked whether Kevin could find efficiencies. Kevin found them: he removed the 6-day row from the table. The plan is now officially 20 days with a 100% chance of success. The launch party is still on day 21. Kevin has bought a ticket to it, refundable.
What this can't tell you
- The task odds are an example. Your projects have their own pattern; the 13% comes from our assumed odds, not from a study.
- Tasks aren't always independent. If one problem delays several tasks at once, the tail gets worse than in our model.
- The 1994 study is small. 37 students and one kind of project; later research found the same pattern widely, but sizes vary.
Kevin's project and the task odds are an illustration; the simulation assumes ten independent tasks with the odds in the table. The thesis figures come from the published study (Journal of Personality and Social Psychology, 1994). Educational content, not financial advice.