Our NPS Dropped 12 Points. Should We Worry?
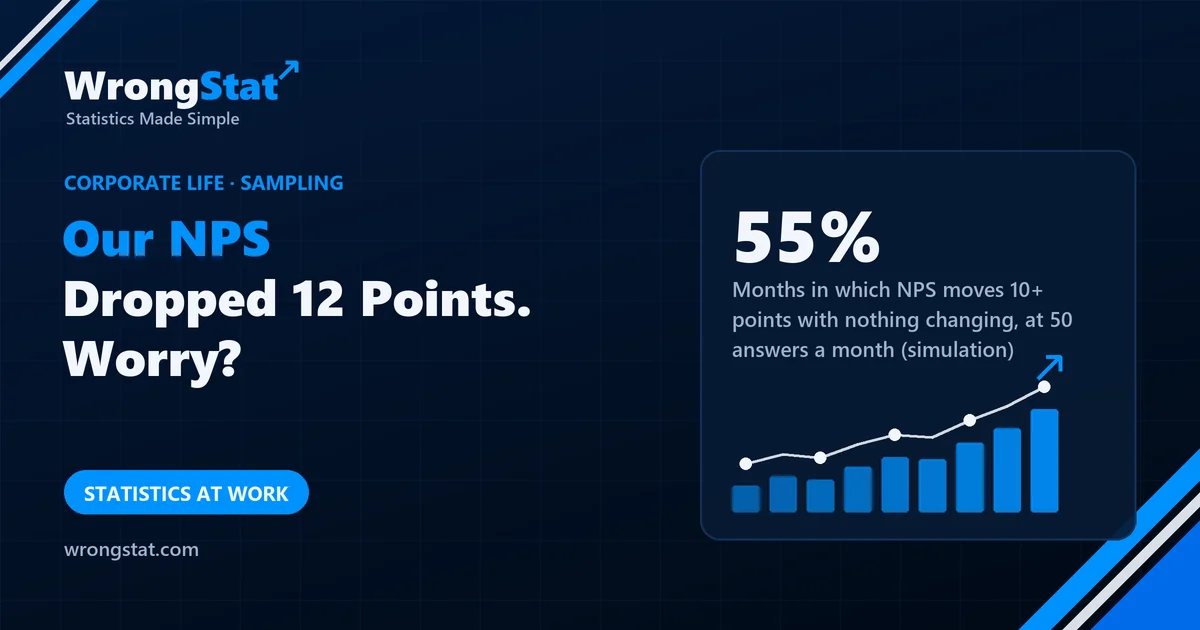
The short version: probably not, if it's based on a few dozen answers. NPS is the share of customers who score you 9 or 10 minus the share who score 0 to 6, so it moves twice as much as a normal percentage. In our simulation of a true score of 30 that never changes, a monthly survey of 50 customers gives results anywhere from about 8 to 52, and the score moves 10 points or more from one month to the next 55% of the time. With 400 answers, that falls to 7%. Over a year of 50-answer months, the best and worst month typically differ by 36 points with nothing happening at all.
Monthly dashboard. Net Promoter Score: 22, down from 34. The number is red. The customer experience team has called an urgent meeting titled "NPS crisis: root causes and actions".
Kevin looks at the small print. This month, 47 customers answered the survey. Last month, 52.
Kevin asks how many points the score usually moves when nothing happens. Nobody in the meeting knows. They have a slide with nine root causes.
How NPS works
Customers answer one question: how likely are you to recommend us, from 0 to 10? Those who answer 9 or 10 are promoters, 7 or 8 passives, 0 to 6 detractors. The score is the percentage of promoters minus the percentage of detractors, so it runs from minus 100 to plus 100.
Because it's a difference between two percentages, it's noisier than either of them. One customer moving from promoter to detractor shifts the score twice: one fewer promoter, one more detractor. With 50 answers, that single customer moves it 4 points.
How much a score jumps when nothing changes
We simulated a company whose customers never change: half are promoters, 30% passives, 20% detractors, a true score of 30. Each month a random sample answers the survey.
| Answers per month | 95% of monthly scores fall between | Score moves 10+ points from last month |
|---|---|---|
| 30 | 0 and 57 | 64% |
| 50 | 8 and 52 | 55% |
| 100 | 14 and 45 | 39% |
| 400 | 22 and 38 | 7% |
With 50 answers, a drop from 34 to 22 is ordinary noise. Over a year of such months, the best and the worst month typically differ by 36 points, and in 22% of years there are three falls in a row somewhere, enough for a trend line and a strategy day, with the customers exactly the same as before.
Months in which NPS moves 10+ points with nothing changing
Statistics for noobs: the margin of error on a score
Every survey result has a margin of error: how far it could easily be from the truth just because of who happened to answer. It shrinks with the sample size, but slowly: to halve it, you need four times as many answers.
Two practical rules: before reacting to a change, ask how big a change is normal for this many answers; and look at several months together, or at a rolling average, instead of reacting to each one.
Where it costs you money
A month of fund returns, a quarter of a manager's record or a week of a strategy's results is a small sample too. Big swings in small samples are normal, and so are three bad months in a row. Judge on the long record, with its own margin of error.
The moral
The crisis meeting agreed nine actions, one for each root cause. Next month NPS rose to 36. The customer experience team presented this as proof that the actions worked, although only two of them had started. Kevin has suggested pausing the actions for a month to see what happens. The team has rejected this as too risky.
What this model can't tell you
- A model of random answers. Real surveys also have bias: unhappy or very happy customers may be more likely to answer.
- Real changes happen. A big drop with hundreds of answers, or one that lasts several months, deserves a look. The point is to check the noise first.
- The example mix is ours. Different shares of promoters and detractors give slightly different ranges, but always this wide for this few answers.
The dashboard, the meeting and the nine root causes are an illustration. The figures come from our own simulation of 400,000 survey samples per row from a customer base with a true score of 30 (50% promoters, 30% passives, 20% detractors). Educational content, not business or financial advice.