Corporate life · Murphy's laws
The Matthew effect: how identical sales reps end up a star and a straggler
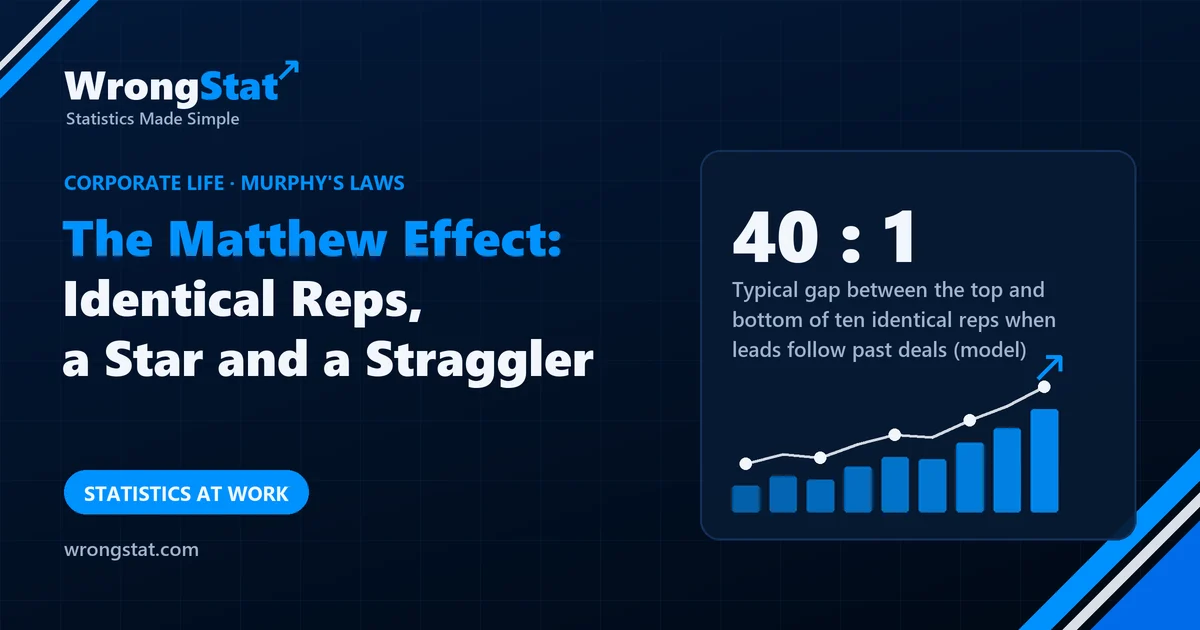
The short version: when success brings more chances to succeed, small early differences, often just luck, grow into huge gaps. In our model of ten identical sales reps, where each new deal is assigned in proportion to the deals each rep already has, the top rep ends up with 29% of all deals instead of about 13% under equal assignment, and the typical top-to-bottom ratio is about 40 to 1. With two identical reps, there's a 40% chance one ends with four times the other's deals. Rerun the year and a different rep comes top 90% of the time.
The sales team has a simple rule: the warmest leads go to whoever closed the most deals the month before. "Reward the best," says Kevin's boss. In January, Darren closed two deals and everyone else one. By June, Darren is getting the best leads every week and has three times as many deals as anyone else.
He's been asked to give a talk on his "closing mindset". Kevin, who sat next to him in January, remembers that both of Darren's early deals were customers who phoned in by themselves.
The law
The sociologist Robert Merton named it in 1968, in a paper in Science about how famous scientists get more credit for the same work: the Matthew effect, after the verse in the Gospel of Matthew, "to every one that hath shall be given". Whenever past success brings more opportunities, the rich get richer, whether or not they were better to begin with.
Ten identical reps
Mathematicians model this with Pólya's urn, from 1923: every time a ball of some colour is drawn, another of that colour goes back in. We gave ten equally good reps one deal each, then handed out 300 more, each going to a rep with probability in proportion to the deals that rep already had:
| Result after a year | Leads shared equally | Leads follow past deals |
|---|---|---|
| Top rep's share of deals | 13% | 29% |
| Top 3 reps' share | about 35% | 63% |
| Typical top-to-bottom ratio | under 2 to 1 | about 40 to 1 |
Nobody in this model is more talented than anyone else. The whole gap comes from early luck being fed back in as opportunity. That feedback is cumulative advantage. With just two identical reps, the final split is equally likely to be anything from 50:50 to 99:1, so there's a 40% chance one rep ends with four times the other's deals.
And if you rerun the year with the same ten people, a different rep comes top 90% of the time. A sociology experiment by Salganik, Dodds and Watts in 2006, in which thousands of people rated songs while seeing or not seeing others' downloads, found the same thing: social influence made hits bigger and made it harder to predict which songs would become them.
Share of deals per rep after a year, ten identical reps (one typical run)
Statistics for noobs: when results feed back into chances
Most statistics assume each result is independent of the last. When results change the odds of future results, small random differences get amplified, and the final ranking says more about the early luck than about the people. Before crediting the winner, ask whether winning earlier made winning later easier.
Where it costs you money
Fund flows work the same way: a fund with a lucky good year gets more money, more marketing and more attention, and its manager is treated as a genius. The size of the following doesn't tell you whether the first result was skill.
The moral
Kevin showed his boss the simulation. The boss agreed that leads should be shared more fairly and introduced a new rule: leads are divided equally, except the best ones, which go to whoever has closed the most this year. Darren's talk, "Mindset Is Everything", is scheduled for next Friday. Attendance is compulsory.
What this model can't tell you
- Real reps differ. Skill matters; the model shows how big a gap the feedback alone can produce.
- Our assignment rule is extreme. Partial feedback gives smaller gaps, but the same direction.
- Rewards can be fair and still feed back. The question is whether a reward also changes the next round's chances.
The sales team, Kevin's boss and Darren's talk are an illustration. The Matthew effect is from Robert K. Merton in Science (1968); the urn model is from Eggenberger and Pólya (1923); the music experiment is Salganik, Dodds and Watts in Science (2006). The figures are our own simulation of ten identical reps and 300 deals. Educational content, not business or financial advice.