Myth #21 · Fear gauge
Should You Stop Buying Dips When the VIX Is High? We Tested Four Levels of Fear.
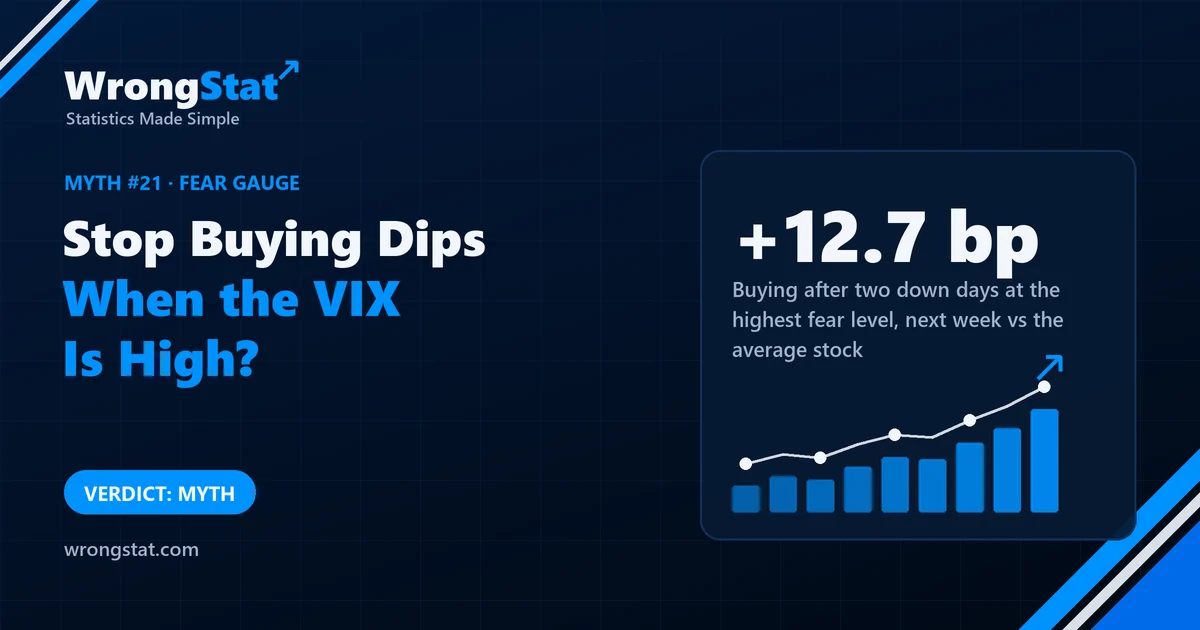
Verdict: myth, in our data. From 2010 to 2026, buying US stocks after two down days did no worse when the VIX was at its highest; it beat the average stock by 12.7 basis points over the next week, against 5.1 at the calmest level, a difference too small to be sure of. A second dip rule showed nothing either way. What really suffered at high fear was buying stocks near their recent highs: -65.2 basis points. We found no evidence for the rule; that's not proof it can never help.
Cousin Kevin buys dips. He's read that the one time you must never buy dips is when the VIX, the market's "fear gauge", is at its highest. "When fear spikes," he says, "dips turn into cliffs." He has a sticky note on his screen that says "VIX HIGH = HANDS OFF".
Uncle Gary says the best time to buy is when everyone is scared. They've agreed to let us settle it, and to keep arguing afterwards regardless.
What we tested
- Four levels of fear: each day, the VIX was placed in one of four bands of its range over the previous 100 days, from calmest to most fearful. From 2010 to 2026: 2,372 calm days, 1,026 and 456 in between, and 267 days of the highest fear.
- Two dip rules: a stock that has fallen two days in a row; and a stock with a very oversold short-term indicator (2-day RSI below 10) while still above its 200-day average.
- One opposite rule: a stock closing within 2% of its 20-day high, the kind of stock breakout traders buy.
- The trade: buy at the next open, hold to the close five days later.
- The comparison: the average of all stocks over the same days. That matters a lot here, because after the most fearful days the whole market tended to bounce.
The result
| Over the average stock, next week | Calm | Level 2 | Level 3 | Highest fear |
|---|---|---|---|---|
| After two down days | +5.1 bp | +8.3 bp | +9.9 bp | +12.7 bp |
| Oversold, above 200-day average | +2.5 bp | -0.5 bp | +0.4 bp | +5.8 bp |
| Near the 20-day high | -4.9 bp | -6.6 bp | -19.7 bp | -65.2 bp |
A basis point (bp) is a hundredth of a per cent. The dip after two down days didn't turn into a cliff at high fear; it did slightly better, though the difference between the highest-fear days and the rest (6.2 basis points) was well within chance (p = 0.58). The oversold rule showed nothing meaningful at any level. Kevin's sticky note has no support in this data.
The surprise was the third row. Buying stocks near their recent highs did worse than the average stock at every fear level, and much worse at the highest: 65 basis points in a week. That difference was significant (p = 0.006). One likely reason: when the market panics and then rebounds, the beaten-down stocks bounce hardest and the ones still near their highs lag.
Next week vs the average stock, by VIX level
The raw numbers would have fooled you
Measured on their own, dip buys after the highest-fear days looked spectacular: about +70 basis points in a week. But the average stock gained about 88 in the same weeks, because markets tended to rebound after their scariest days. Most strategies look brilliant in a rebound. Only the comparison with the average stock tells you whether the rule added anything.
Statistics for noobs: compare within the same regime
When you split results by market conditions, compare each rule with what everything else did in the same conditions. Otherwise you're measuring the conditions, not the rule. Here, raw returns made every rule look good at high fear and the comparison with the average stock told the real story.
And watch the sample: only 267 days were in the highest fear band. That's enough to see a big effect like the breakout one, not enough to be sure about small ones.
The moral
Kevin's sticky note protected him from nothing in particular. Gary's rule, buying when everyone is scared, looked better in our data, but not by a margin we can be sure of. The one clear lesson was about something neither of them asked: when fear is at its peak, chasing the stocks still near their highs was the worst of the three. Kevin has replaced his note. It now says "VIX HIGH = DON'T CHASE".
Every test on this site is judged against the average stock over the same days. Here that comparison turned a spectacular-looking result into a modest one, and showed where the real damage was.
What this test can't tell you
- One way of defining fear levels. Other ways of splitting the VIX might give different groups of days.
- Before costs, five days ahead. Trading costs and other holding periods weren't included.
- US stocks listed today, which brings survivorship bias: stocks that collapsed in panics and disappeared are missing, which flatters dip buying.
- Absence of evidence. "No support for the rule in our test" isn't proof that fear never matters for dip buying.
Statistical tests on historical data, not real trades. Daily prices of US stocks listed today and the VIX index, 2010 to 2026, before trading costs, compared with the average stock over the same days. Historical results do not guarantee future returns. This is educational content, not financial advice.