Corporate life · Reading charts
How many data points make a trend? Too few, then suddenly too many
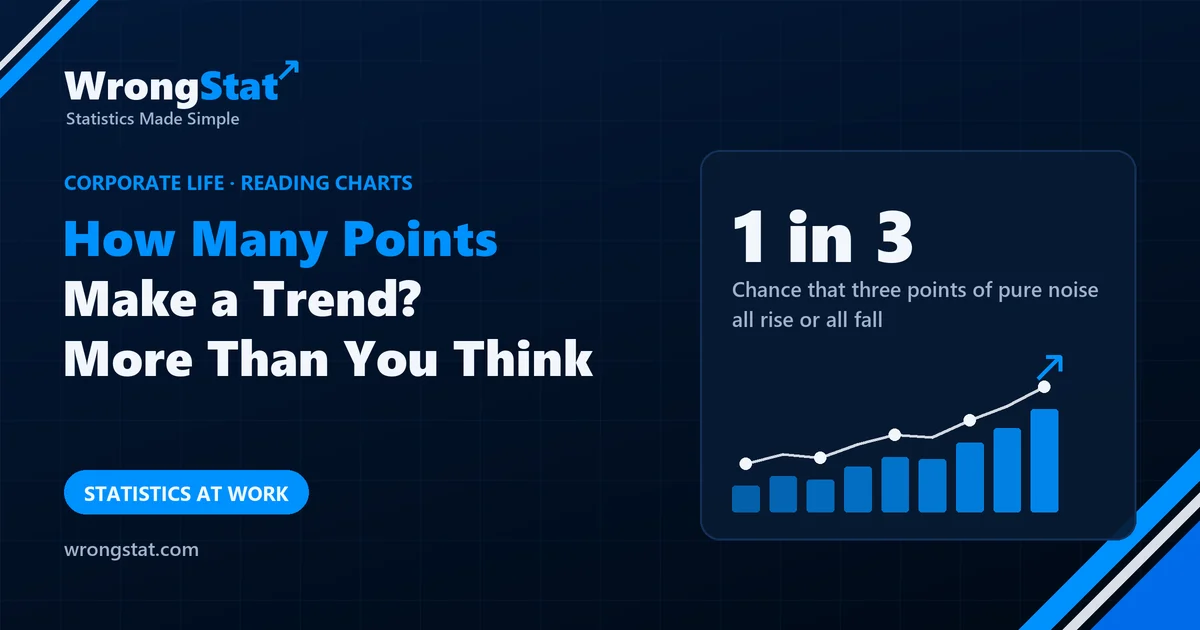
The short version: three points are not enough to call a trend. If a measurement just bounces around at random, three points in a row all rise or all fall one time in three. Quality-improvement charts use a stricter rule, five (or six) points in a row all going the same way, which pure noise produces at a given spot only 1.7% (0.28%) of the time. But search a long chart and even that turns up by chance: somewhere in 36 months of noise, 37% of the time. Pick the rule and the time scale before you look, and never apply it to running totals.
On Monday there was a chart on the kitchen fridge. Three dots: July 71, August 73, September 76. A blue marker line ran through them, on past October and off the edge of the paper, stopping only because the fridge did. Across the top: MOMENTUM.
"Three months in a row," said Kevin's boss. "Since Smile First."
Smile First required everyone on the phones to use the customer's first name three times per call. Customers had been informed of this three times per call.
"It's a trend. The board meets on Friday. Extend the line to December."
Kevin extended it. It came out at 83.5. The boss rounded it to 84, because it was a bold initiative.
Then Kevin downloaded three years of the score. It had risen three months in a row six times before, once while the new ticket system was losing one ticket in four. Nobody had pinned that one to the fridge. Customers, it seemed, were happiest when nobody could find their complaint.
"So you're saying Smile First doesn't work," said the boss.
"I'm saying three points can't tell. Pure noise climbs three months in a row one time in six. Hospitals call it a trend at five points. Factories at six."
"The board meets on Friday."
"Use weeks," said Darren, passing with a mug. Darren had spent nine years solving other people's problems while passing with a mug.
Thirteen weekly points. Not five in a row anywhere.
"Days," said the boss.
Sixty-five working days. Five rising days in August. The boss was happy for about a minute, which is how long it took Kevin to find five falling days in September.
"Look in enough places and you'll find anything," said Kevin. "Sixty-five days of noise contain five in a row more often than not."
"So three points are too few, sixty-five are too many, and five would do, but only if they're months, which we don't have."
"Yes."
The boss went to the fridge and added, very small, under MOMENTUM: "(preliminary)". It was the first honest word on that fridge since the label on the milk.
On Friday he told the board that, under the rules hospitals use, the trend was not yet confirmed. The board nodded. It sounded rigorous, and rigour is cheap before the data arrive.
Then Margaret from finance stood up. "The cost of Smile First, April to September. Six points, each higher than the last. Under the rule Kevin's team sent round, that isn't just a trend. That's a factory-grade trend. I assume we're extending the line to December."
It was a running total. Money spent can't go down. Everyone in the room knew it, which is why nobody said it.
"Noted," said the chair. "We'll revisit both trends in December."
On Monday the fridge had a new chart: three dots, two empty circles, no line. Underneath, in pencil, someone had added the coffee capsules used since January, cumulative. Every point higher than the last. MOMENTUM.
Darren said it was the only trend in the building with a confirmed cause.
How often noise climbs by itself
Suppose a score doesn't really change at all and just bounces around the same level. Then any set of points is equally likely to come out in any order, and only one of those orders is "each higher than the last". Three points can be arranged in 6 ways, four in 24, five in 120:
| Points in a row | Chance they all rise, pure noise | Chance they all rise or all fall |
|---|---|---|
| 3 | 1 in 6 (16.7%) | 1 in 3 (33.3%) |
| 4 | 1 in 24 (4.2%) | 1 in 12 (8.3%) |
| 5 | 1 in 120 (0.8%) | 1 in 60 (1.7%) |
| 6 | 1 in 720 (0.14%) | 1 in 360 (0.28%) |
| 7 | 1 in 5,040 (0.02%) | 1 in 2,520 (0.04%) |
If three falling months would have worried you as much as three rising ones excited you, noise hands you a "trend" one time in three. "Three data points is a trend" is a rule for presentations, not for evidence.
The rules people actually use
Quality-improvement teams read charts like this every week, and they agree the rules before they look. On healthcare run charts, a widely used rule (described by Perla, Provost and Murray in BMJ Quality & Safety in 2011) calls it a trend when five or more points in a row all go up or all go down. In manufacturing, one of Lloyd Nelson's tests for control charts (Journal of Quality Technology, 1984) uses six. Those thresholds are strict on purpose: at one place chosen in advance, noise produces five such points 1.7% of the time and six 0.28% of the time.
More data, more fake trends
The catch is "at one place chosen in advance". A long chart has many places where a run can start, and the same problem as multiple testing appears: look in enough places and something rare turns up. In our simulation of pure noise (20,000 random series for each length):
| Points on the chart | Chance of 5+ in a row somewhere | Chance of 6+ in a row somewhere |
|---|---|---|
| 13 (a quarter, weekly) | 13% | 2% |
| 36 (three years, monthly) | 37% | 7% |
| 65 (a quarter, working days) | 59% | 14% |
| 250 (a year, working days) | 97% | 45% |
That is why switching from months to days "found" a trend in both directions. It's also why a 2014 simulation study by Jacob Anhøj and Anne Vingaard Olesen in PLoS ONE concluded that the trend rule is almost useless for spotting a slow, steady drift and recommended dropping it in favour of other run-chart rules, such as an unusually long run of points on one side of the median.
Running totals and averages always "trend"
The rules only work on the measurements themselves. A running total of anything that can't be negative, such as money spent or coffee drunk, rises at every point by construction, so it passes any trend test ever written. A moving average is subtler: each point shares most of its data with its neighbour, so neighbouring points move together. That's autocorrelation, and it draws runs for you. In our simulation, a three-month moving average of pure noise over three years contains five or more points in a row going the same way in 88% of cases.
Statistics for noobs: a trend is a claim about the next point
Calling something a trend is a forecast: it says the next point will probably carry on in the same direction. Noise can't be forecast. So before you call it, ask one question: if nothing had changed at all, how often would a chart like this turn up? If the answer is "one time in three", you're looking at the clustering illusion, not momentum.
Where it costs you money
A share price, a fund or a sales figure that has gone up three periods in a row is the most common chart in any pitch. Under pure noise it happens one time in six at any given spot, and somewhere in a long history almost always. A run says little about the next period unless you know why it happened and the rule was fixed before anyone looked.
The moral
Three points can't separate a trend from noise, and searching sixty-five points will find one whether it's there or not. Decide the rule and the time scale before you look, count the measurements themselves rather than totals or averages, and when the rule says "not yet", the honest answer is "we don't know yet", not "it doesn't work".
What this can't tell you
- No run doesn't mean no change. A real but slow improvement can hide in noise for months, and a five-point rule on monthly data needs five months even when the effect is real. Not finding a trend is not proof there isn't one.
- The rules assume a stable process. Seasons, a December rush or a change in how the score is measured break that assumption.
- A run says something changed, not why. Smile First, a new product or calmer customers in summer would all look the same on the chart.
- The percentages assume pure noise with no ties. The tables for whole charts and moving averages come from our own simulation.
Kevin, his boss, Darren, Margaret and Smile First are an illustration, and the satisfaction scores are made up. Under pure noise, the chance that k points come out in rising order is 1 in k factorial. The five-point trend rule is described in Perla, Provost and Murray, BMJ Quality & Safety (2011); the six-point rule is one of Lloyd Nelson's tests, Journal of Quality Technology (1984); the criticism of the trend rule is from Anhøj and Olesen, PLoS ONE (2014). The figures for whole charts and for moving averages come from our own simulation of 20,000 random series per length. Educational content, not business or financial advice.