Are Executives Overconfident? 80% Ranges That Were Right 36% of the Time
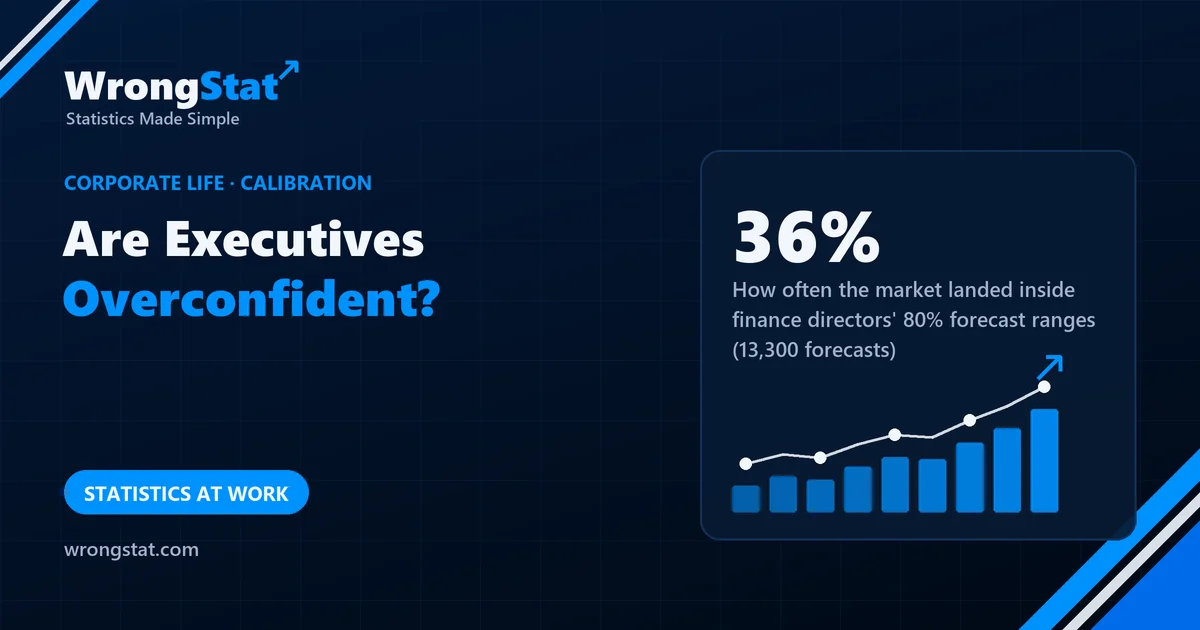
The short version: yes, at least about the stock market. In a survey of US chief financial officers from 2001 to 2011, with more than 13,300 forecasts, executives gave a range for the next year's S&P 500 return that they were 80% sure would contain it. The real return fell inside only 36% of the time. Their ranges were far too narrow: with typical market volatility, an honest 80% range for a year is around 40 percentage points wide. The same executives' confidence showed up in their companies' own plans.
Budget meeting. The finance director presents next year: revenue growth of 8%, "with a range of 6 to 10%". Kevin's boss writes it down. The range looks careful and professional.
Kevin asks how often the actual number has landed inside the range in previous years. The finance director says that's not how ranges work. It turns out it is exactly how ranges work.
What a range promises
If you say you're 80% sure the answer is between 6 and 10, you're making a promise that can be checked: over many such ranges, about 8 in 10 should contain the real answer. If 9 in 10 do, your ranges are too wide. If 4 in 10 do, they're too narrow. A forecaster whose ranges hit at the promised rate is well calibrated.
The CFO survey
For about ten years, from 2001 to 2011, a university survey asked chief financial officers of US companies every quarter to forecast the S&P 500's return over the next year. They gave a best guess and two more numbers: a level they thought there was only a 10% chance of falling below, and one with only a 10% chance of being exceeded. Between them: an 80% range.
Researchers collected more than 13,300 of these forecasts and checked them against what the market actually did.
| Share of years inside the range | |
|---|---|
| What an 80% range promises | 80% |
| What the CFOs' ranges delivered | 36% |
How wide should the range have been? The stock market's yearly return typically varies by about 16 percentage points either way (its standard deviation). An honest 80% range is about 1.28 standard deviations each side of the guess: roughly 40 percentage points wide in total. The executives' ranges were a fraction of that.
How often the stock market landed inside an 80% forecast range
Why narrow feels right
A wide range sounds like not knowing. "Somewhere between minus 10% and plus 30%" doesn't sound like something a finance director should say in a board meeting. A narrow range sounds like expertise. The result is overconfidence: ranges chosen to sound knowledgeable rather than to be right 80% of the time. The researchers also found that the more miscalibrated CFOs ran companies that invested more and borrowed more.
Statistics for noobs: score your own ranges
Write down ten forecasts with 80% ranges: delivery dates, project costs, sales next month. Later, count how many landed inside. If it's far below 8, widen your ranges until it isn't. Most people need to make them much wider than feels comfortable.
A confidence interval in statistics works the same way: its width is set by how uncertain the data are, not by how confident anyone feels.
Where it costs you money
A strategy expected to return "8 to 12% a year" is making a promise about a market that moves 16 points in a typical year. Ask for the record of the forecaster's past ranges before trusting the new one, and plan for the outcomes outside it.
The moral
Kevin pulled up the last five budgets. The actual growth had been inside the "range" once. The finance director agreed to widen next year's range to between 2 and 14%. The board rejected it as "too uncertain to plan with" and approved 6 to 10%, which it found more reassuring. Growth came in at 1%.
What this study can't tell you
- Stock market forecasts. The executives were forecasting the market, not their own companies; they may know their own business better.
- A turbulent decade. 2001-2011 included two big crashes, which made narrow ranges look especially bad. But the miss was large in ordinary years too.
- Our width estimate is rough. The 40-point figure uses a typical yearly volatility of about 16%; in calmer or wilder years it changes.
The budget meeting and the finance director are an illustration. The 36% and the number of forecasts come from a study of the Duke CFO survey (Quarterly Journal of Economics, 2013). The width of an honest range is our own estimate. Educational content, not financial advice.