Why a Team at 95% Utilisation Is Always Late
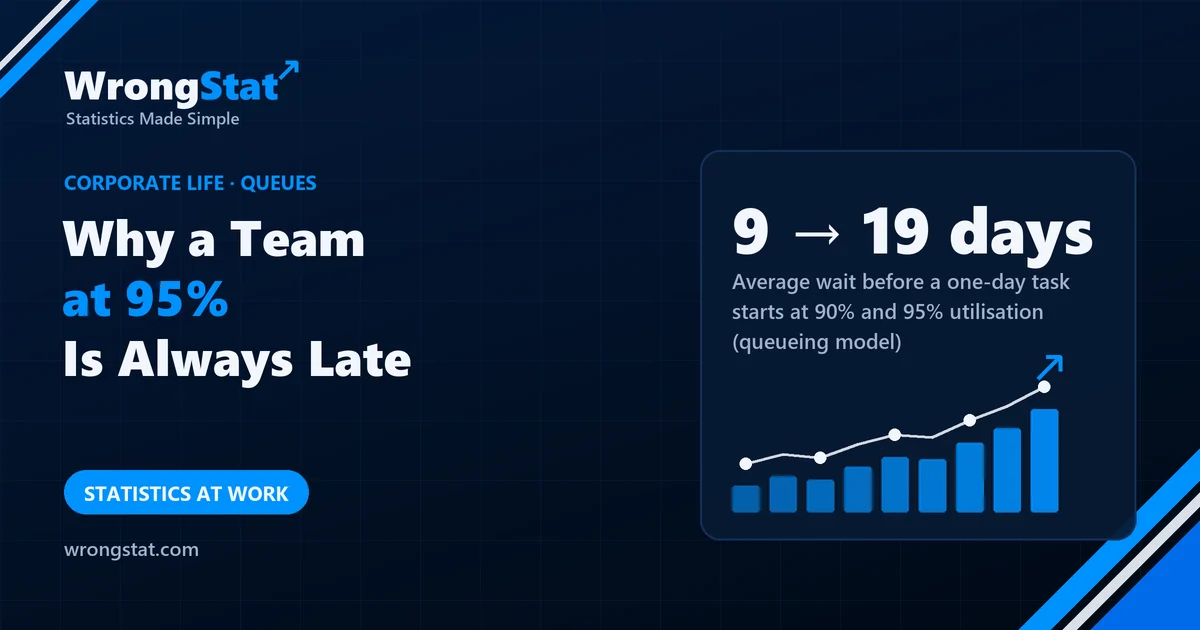
The short version: when work arrives unevenly and tasks vary in length, waiting time grows slowly at first and then explodes as utilisation approaches 100%. In the standard queueing model, with tasks taking a day on average, the wait before work even starts is about 1 day at 50% utilisation, 4 days at 80%, 9 days at 90%, 19 at 95% and 99 at 99%. Going from 90% to 95% busy doubles the wait. A team kept almost fully busy will always have a long queue, however hard it works.
New directive: the team's utilisation must rise from 80% to 95%. Idle time is waste, the boss explains; the dashboard will show each person's percentage weekly.
Two months later the team is at 94%, and customers are complaining that requests take three weeks. The boss is puzzled. Everyone is busier than ever, so how is everything slower?
Why busy means slow
Work doesn't arrive evenly. Some days bring five requests, some none; some tasks take an hour, some three days. When a team has spare capacity, a burst of work is cleared quickly. When the team is almost always busy, every burst joins the back of a queue that never gets a chance to empty.
The standard model of this, from queueing theory, assumes requests arrive at random and task times vary at random. It gives a simple rule for the average wait before a task starts, in units of the average task time: utilisation divided by spare capacity. The key number is utilisation, the share of time the team is busy, and its effect is anything but a straight line.
| Utilisation | Average wait before a 1-day task starts |
|---|---|
| 50% | 1 day |
| 70% | 2.3 days |
| 80% | 4 days |
| 90% | 9 days |
| 95% | 19 days |
| 99% | 99 days |
We checked the 90% row by simulating two million tasks: the average wait came out at 9.0 days. The jump from 90% to 95% doubles the wait; from 95% to 99% it multiplies it by five. The last few percent of utilisation are paid for in weeks.
Average wait before a one-day task starts, by team utilisation
What to do instead
- Target speed, not busyness. Measure how long requests take from arrival to done, not how full people's calendars are.
- Keep slack on purpose. Teams that must respond quickly, such as support, operations or emergency services, plan for well under full utilisation.
- Reduce the variation. Splitting large tasks and smoothing arrivals shortens queues at the same utilisation.
Statistics for noobs: averages hide queues
"We have 100 hours of work a week and 105 hours of people" sounds fine on average. But queues are made by variation, not by averages: the weeks with 130 hours of work pile up, and the weeks with 70 don't give the time back, because idle hours can't be stored. Whenever demand varies, capacity has to be planned for the spread, not just the mean.
Where it costs you money
Being fully invested at all times is a utilisation target for money: no slack for opportunities or emergencies. A cash buffer, like spare team capacity, looks wasteful on average and pays for itself in the bad weeks.
The moral
Kevin showed the boss the table. The boss agreed that waiting times matter and added a second dashboard metric: average waiting time, also to be reduced. To improve both, the team now closes requests as soon as they arrive and reopens them as new requests when work actually starts. Utilisation is 96%. Waiting time is zero. Customers are still waiting three weeks.
What this model can't tell you
- A simple queue. The model is one team taking tasks in turn, with random arrivals and random task times. More predictable work queues less; more erratic work queues more.
- Real teams adapt. People speed up, cut corners or drop work when queues grow, which changes the numbers but rarely for the better.
- Units. The waits are in multiples of the average task length; with two-hour tasks, multiply by two hours, not a day.
The directive, the dashboard and the boss are an illustration. The figures come from the standard single-server queueing model with random arrivals and random task times (often written M/M/1), checked against our own simulation of two million tasks at 90% utilisation. Educational content, not business or financial advice.