Were the 2016 Election Polls Wrong? What a 71% Chance Means When It Loses
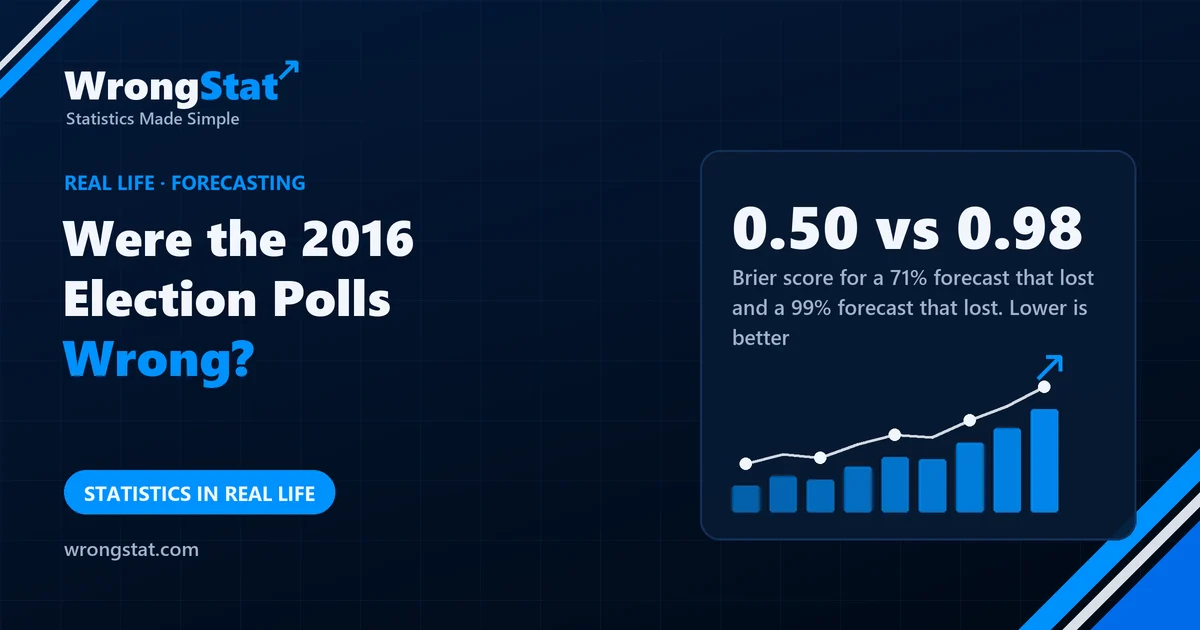
The short version: in 2016, the final national polls showed Hillary Clinton ahead by about 3.2 points; she won the popular vote by 2.1, a miss of about one point, which the polling industry's review called very accurate by historical standards. State polls in several key states missed by more, partly because many didn't adjust for education (college graduates answer surveys more readily) and partly because of late deciders. Forecasts built on the polls gave Clinton anywhere from about 71% to 99%. A 71% chance means losing about 3 times in 10; one loss can't prove it wrong, but a scoring rule such as the Brier score shows that the 99% forecast was far more wrong than the 71% one.
At Sunday lunch, the conversation reached elections, which Aunt Linda had specifically asked it not to. Uncle Gary made clear he wasn't talking about who should have won. "I don't care about the politics," he said. "I care that the computers said 71% and they were wrong. So they're useless."
Mia asked what would have happened if the 71% candidate had won. Gary said that would have been obvious, so the forecast wouldn't have told anyone anything. Mia asked what kind of forecast he would accept. Gary said one that was right. Mia asked whether 71% could ever be right. Gary said only if it was 100%. Linda brought out the dessert, which she had also specifically asked not to need early.
What the forecasts actually said
On election day 2016, forecasts based on the polls gave Hillary Clinton very different chances of winning:
- One well-known model: about 71%.
- Another: about 85%.
- Several others: 98% to 99%.
They all used broadly the same polls. They disagreed about how much the polls could be wrong together, in the same direction, in similar states. The 71% model allowed for that most; the 99% models allowed for it least.
Were the polls wrong?
Less than people remember. The final national polls had Clinton ahead by about 3.2 percentage points on average. She won the national popular vote by 2.1. A review by the American Association for Public Opinion Research called the national polls among the most accurate in decades.
The bigger misses were in state polls, especially in the upper Midwest, which decided the result through the Electoral College. The review found two main reasons:
- Who answers. People with college degrees are more likely to answer surveys. Many state polls didn't correct for that, and in 2016 education was strongly linked to voting. That's nonresponse bias: the people who reply are different from the people who don't.
- Late deciders. Voters who made up their minds in the final days broke towards one side in several key states, after most polls were finished.
Those state errors also pointed the same way, which is exactly the shared error the more cautious forecast had allowed for.
How to score a forecast
A forecast that says 71% expects to lose about 3 times in 10. One loss doesn't show it was wrong, just as one rainy day doesn't show a 30% rain forecast was wrong. What you can do is score forecasts so that confidence costs something when it fails. The usual tool is the Brier score: square the probability you gave to the thing that didn't happen. Lower is better; 0 is perfect; saying 50% on everything always scores 0.25.
- 71% for the loser: 0.71 × 0.71 = 0.50.
- 85%: 0.72.
- 99%: 0.98, almost the worst score possible.
On a single election, none of them did well. But the 99% forecast was punished almost twice as hard as the 71% one, which is fair: it claimed to know much more. Over many elections, a good forecaster's 70% calls come true about 70% of the time. That's calibration, and it can only be checked across many forecasts, never one.
Brier score when the favourite lost (lower is better)
How to read a forecast
1. Turn the percentage into a sentence. 71% means "this happens about 7 times in 10, and the other 3 times aren't a scandal".
2. Ask how the forecaster does over many calls. One hit or miss says almost nothing. A track record of hundreds says a lot.
3. Be most suspicious of 99%. Very high confidence is only worth having if the errors really are small and independent. In elections, they rarely are.
Where it costs you money
"80% chance of a rate cut", "90% probability of recession": financial forecasts are probabilities too, and the same rules apply. Don't throw out a forecaster after one miss or crown one after one hit. Look for a published track record, check whether their 80% calls come true about 80% of the time, and be wary of anyone who is never less than 95% sure.
The moral
Mia gave Gary a deal: for the next year, he'd forecast every family event as a percentage, and she'd score him. Gary agreed, on the condition that 100% was allowed. By March he had given 100% to Linda's lasagne being ready by six (it was ready at seven), 100% to Kevin arriving on time (he did not), and 100% to his team winning the derby (they drew). His Brier score is the worst in the family. He says the scoring system is biased against confident people. Mia says that's the point of it.
The lunch is fictional and takes no side in any election. Poll and result figures are from the American Association for Public Opinion Research's 2017 evaluation of 2016 polling; forecast probabilities are rounded final published values; Brier scores are our calculations for a single event. Educational content, not financial advice.