Corporate life · Winner's curse
Why the Winning Ad Always Disappoints After Launch
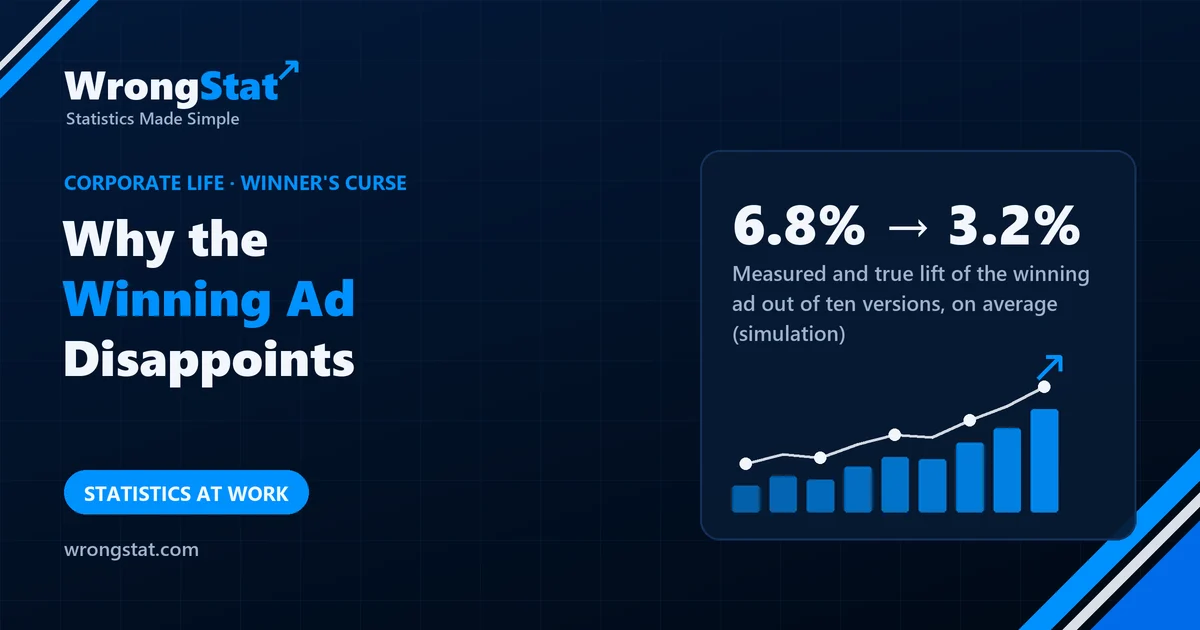
The short version: when you test several options and pick the one that measured best, you pick it partly for being lucky, so its measured result is too high. In our simulation of ten ad versions with real but small differences, the winner measured an average lift of 6.8%; its true lift averaged 3.2%, less than half. In about 1 test in 10, the winner wasn't better than the control at all. Re-testing the winner on fresh traffic gives an honest estimate, and that's the number to plan with.
Marketing ran a big test: ten new versions of the homepage ad against the old one, 20,000 visitors each. Version 7 won with a 6.8% lift in sign-ups. The forecast for next year was raised by 6.8%.
Three months after launch, the lift is about 3%. The marketing director suspects the market has changed. Kevin suspects the test.
What happens when you pick the best
Every measurement is the true value plus noise. With ten versions, some get lucky noise and some unlucky. The one that comes out on top is usually a version that is genuinely decent and also had good luck in the test. Once it's launched, the luck is gone and only the genuine part remains. So the winner's result after launch is, on average, lower than in the test. This is the winner's curse.
How big the curse is
We simulated 200,000 such tests. Each of the ten versions had a real effect, drawn at random around zero (most versions slightly better or worse, a few clearly), and each was measured on 20,000 visitors against a control.
| The winning version | Average |
|---|---|
| Lift measured in the test | +6.8% |
| Its true lift | +3.2% |
| Lift when re-tested on fresh traffic | +3.3% |
| Winner truly no better than the control | about 1 test in 10 |
| Winner truly the best of the ten | 42% |
The winner usually is a good choice: its true lift is positive most of the time. The problem is the size. Planning on the test figure means planning on twice the real effect.
Why more options make it worse
The more versions you test, the more chances one has of getting very lucky, and the bigger the gap between the winner's measured and true result. Testing 50 headlines and quoting the best one's lift is a reliable way to promise far more than will arrive. It's the same problem as multiple testing: many tries, report the best.
Statistics for noobs: the best measurement is the most inflated
Whenever something is chosen because its number was the highest, expect that number to shrink next time: the top salesperson of the year, the best-performing fund, the winning ad. It isn't that they got worse; the first number included luck. The honest estimate comes from a fresh measurement after the choice is made.
It's a close relative of regression to the mean, applied to a choice you made on purpose.
Where it costs you money
Test 20 trading rules, pick the best backtest, and its result is inflated in exactly this way. The fix is the same: test the winner again on data that played no part in choosing it, and expect the second number to be smaller.
The moral
Kevin proposed re-testing the winner for two weeks before updating forecasts. Marketing agreed, on condition that the re-test included nine new versions, "to keep innovating". Version 4 of the new batch won with a 7.1% lift. The forecast has been raised again.
What this model can't tell you
- Our assumptions about true effects. If real differences between versions are larger, the curse is smaller; if they're tinier, it's bigger.
- The market can change too. Real lifts can also fade because of novelty wearing off. That's another reason the test figure is optimistic, not a reason to ignore the curse.
- Statistical corrections exist. Methods that shrink the winner's estimate towards the average of all versions give better forecasts than the raw winning number.
Marketing, version 7 and the forecast are an illustration. The figures come from our own simulation of 200,000 tests of ten versions with true relative lifts drawn around zero (standard deviation 3%), a 5% base conversion rate and 20,000 visitors per version and control. Educational content, not business or financial advice.